
Have a look at the picture below
Have a look at the picture below
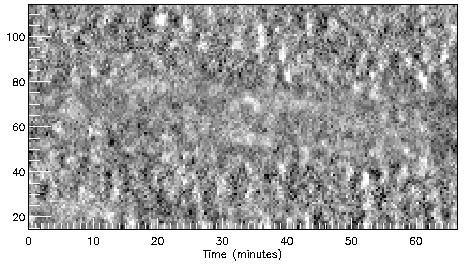
Image copyright of Eoghan O'Shea
This shows some data that I obtained using the SOHO satellite. It's a picture of ultraviolet light observed from the Sun. The image shows how the light from a thin strip of the Sun changes over an hour. The y-axis is position on the Sun in arcsecs (viewed from Earth, one arcsec is about 725km on the Sun). Note the pattern in the image, like ripples in the sea. Each bright spot represents the crest of a wave.
A wave always consists of some sort of up and down motion. The period is the time between two `ups' (or two `downs'!). Have a look at the diagram below. We usually denote the period by a `T'.
Since I've clearly found these regular bursts or variations in the light from the Sun, you might say that the work is finished. I have seen the waves so what more is there to do? Well we still have to understand all the processes causing these pulsations and that is the real challenge.
Remember, if you do something really impressive in science, you may get a wave named after you and maybe even win a Nobel prize!

|