For many years between 1826 and 1843, a German amateur astronomer called Schwabe observed the Sun and counted the number of sunspots he could see. He found that about every 11 years, the number of sunspots goes from small to large and back to small again. This is the solar cycle.
The graph below shows the 11-year cycle from about 1700, but astronomers only start counting cycles from 1755. The first cycle peaked about 1760. You can see from the graph that the maximum number of sunspots changes a lot from each cycle to the next. This makes predicting what will happen in the next cycle very difficult.
Courtesy of the Yohkoh Public Outreach Project
By counting the peaks in the graph and remembering that the peak in 1760 is considered to be the first cycle,
The solar cycle isn't just about sunspots. It turns out that all kinds of things on the Sun (e.g. flares, prominences, and coronal mass ejections go through the same cycle and are most common when sunspots are most common. Thus we can talk about a general solar activity cycle and not just the sunspot cycle.
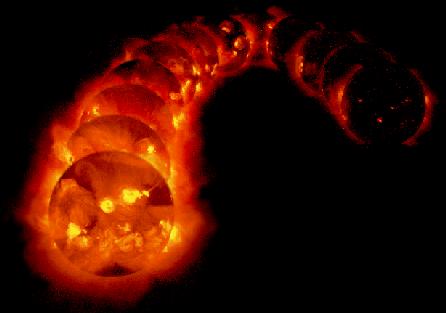
You can see the solar cycle by looking at the changes in the corona.
Here are 12 X-ray pictures of the Sun. The first picture (left) was
taken in 1991, just after the
last maximum of solar activity cycle. The last picture was taken
in 1995, at solar minimum.
Courtesy of the Yohkoh Public Outreach Project
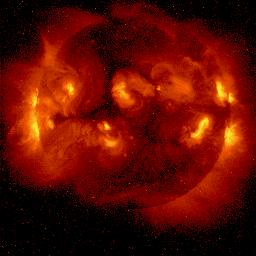
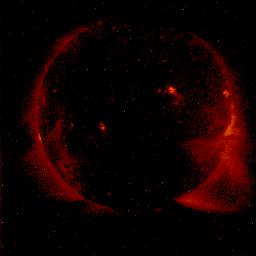
March 1993 (left) and March 1995 (right)
Courtesy of the Yohkoh Public Outreach Project
We know that the solar activity cycle has something to do with the Sun's magnetic field. At the peak of the cycle, the Sun's magnetic field is all twisted up and complicated. At the lowest point of the cycle, the magnetic field is much more simple. We also know that there are strong magnetic fields where sunspots are produced.

|
