Everything You Ever Wanted To Know About
Solar Flares and Explosions But Were Afraid to Ask
Solar flares and explosions on Earth both release energy.
Solar flares release a lot of energy - an awful lot of energy! How
much energy? To get an idea of how much energy is released in a
solar flare we need to compare them to some really big
explosions.
The biggest man-made explosions come from exploding
thermonuclear bombs, so these are the best comparisons we have.
Click on the movie symbol on the right handside
(QuickTime, 7.3Mb).
This is film of the US Army testing three different nuclear weapons
near British owned Christmas Island in The Pacific Ocean. The first
test, codenamed ADOBE, blew up a thermonuclear device on April 25,
1962, had a yield of 190 kilotons.
That's quite a powerful explosion. The second test, codenamed FRIGATE
BIRD, involved a warhead (yield not given) launched on May 6, 1962,
from a submarine and carried to its target by a Polaris missile.
The third tested an atomtic depth charge (20 kilotons), codenamed SWORDFISH, and
was successfully detonated on May 11th 1962.
|

|
Solar flares can explode with a yield of up to 1
billion megatons.
Thermonuclear weapons are not even fleabites by comparison.
But remember it would only take a couple of large thermonuclear bombs
to destroy all life - including YOU and everyone you've ever seen or
even heard of - on Earth. But that, as they say, is another story.
|
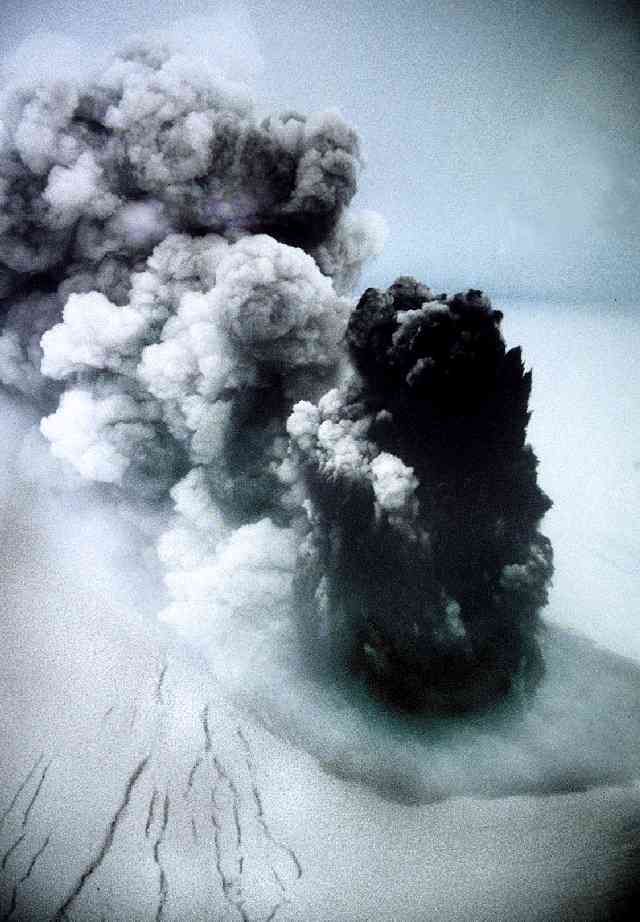
Nature too as some pretty big explosions. Volcanoes release
incredible amounts of energy. Here is a volcanic eruption in
Iceland, under the Vatnajokull ice cap. On the right hand side is
a picture of an
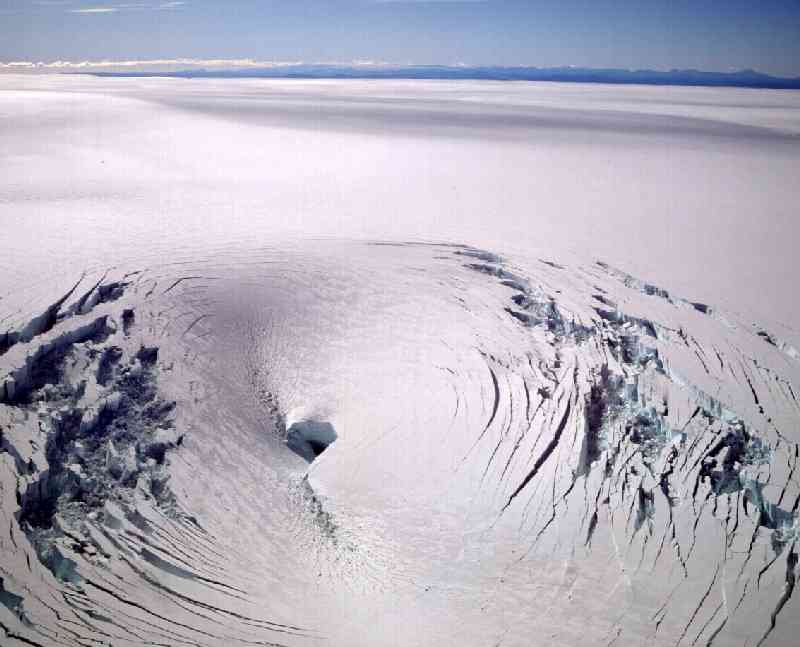
eruption in 1996, which melted 800m of ice. On the right hand side
is the crater which is left (courtesy of Prof Bob White,
Cambridge University).
|
|
|
This what the ice cap looked like afer the explosion. Imagine
all the energy it took to get all that ice. But
even a volcanic explosion is only about one 10 millionth the
energy of a solar flare!
|
| Most flares are quite short really, less than hour.
Although we did see a flare once with the Japanese Yohkoh satellite
which lasted 12 hours.
|
As powerful as the Sun's flares are, it's a bit of wimp when
compared to flares on other stars - some of those flares are a
thousand times more powerful than solar flares and can last as long as
10 days!
|
This is what a flare looks like when we look at it in X-rays with the
Yohkoh satellite. The image of the whole Sun on the left is a
`soft' X-ray image taken with the Soft X-ray Telescope (SXT) on Yohkoh.
Image courtesy G. Holman, NASA/GSFC solar flare theory pages (http://hesperia.gsfc.nasa.gov/sftheory/index.html), S. Masuda. Yohkoh
is a mission of the Japanese Institute for Space and Astronautical Science.
We can see the bright flare on the right hand side edge of the Sun.
The image on the right is a close up of the flare loop that we see in `soft'
X-rays. The colours are showing us where the hottest parts are, so the
hottest bit is the bright yellow at the top of the loop. The blue lines
are a sketch of how we think the magnetic field lines look and where we
think the magnetic energy is changing into other forms of energy.
The white contours (circles) are telling us where the
`hard' X-ray emission is. `Hard' X-rays have more energy than `soft' x-rays.
|
The number of flares that we see depends on how active the Sun is.
The Sun is sometimes quiet while other times it's very active. There
is a rhythm to this activity, an eleven year cycle. At the moment the
Sun is just waking up and there are a lot of
active regions
around, so lots of flares as well.
The plot shows the variation of the Sun's X-ray radiation during Sep
1996. Can you see any flares?
|
|
This plot shows the same thing, except in Sep 1998. How many flares can you see?
It is clear that the numbers of flares which occur depends on the activity cycle
of the Sun. This cycle can be seen clearly in the figure below. This shows images
starting from the left (1991) and ending in 1995 (on the right). The number
of bright active regions
dramatically changes with time.
|
|
Image from the Yohkoh mission of ISAS, Japan.
