|
|
Animations

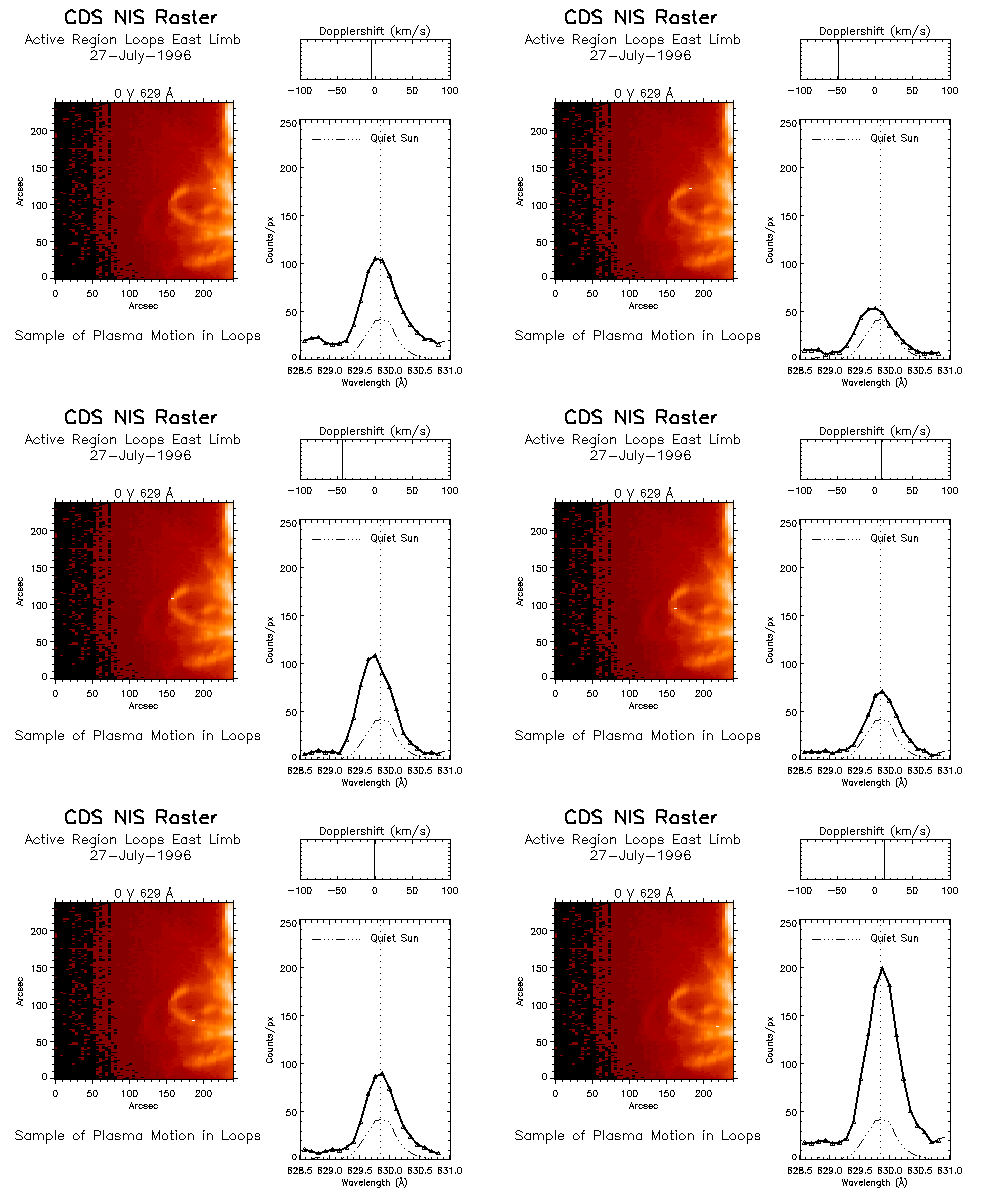
Gas Motion in Loops Observed with CDS (animated gif).
The animation shows an off limb active region observation on July 27 1996 10:00 UT. The image
was created by stepping the CDS spectrograph slit across the FOV. The right panels shows the line
profile from different sections of the loop seen in the left panel. The shift of the spectral line is
shown on a velocity scale in the top right panel. This clearly illustrate the strength of the CDS
instrument which retains the spectral information in the images.

From the CDS Operations Management Team in the Space Science & Technology Department at
CCLRC Rutherford Appleton Laboratory
Site maintained by
John Rainnie.
Last revised on Tuesday (17/Jul/2001) at 10:01.
|
|


