

|
Gallery | |
|
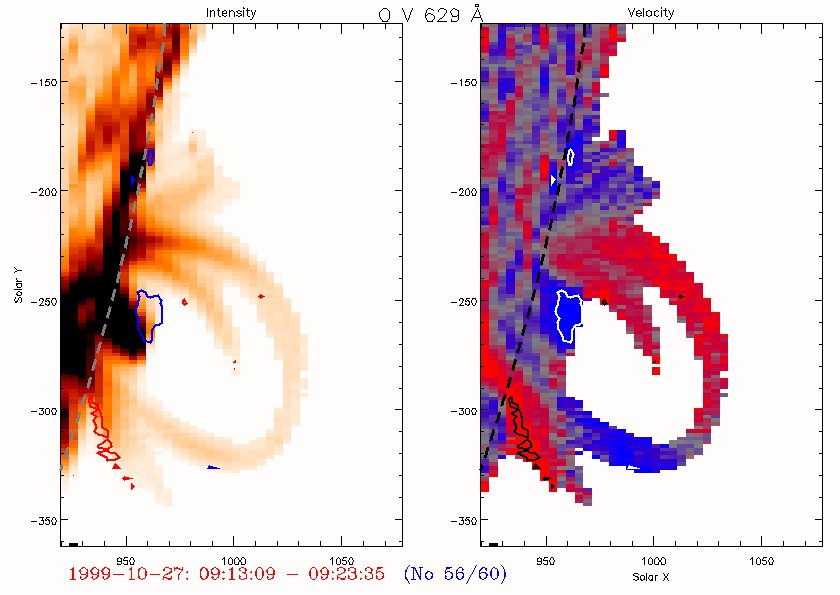 Observing the Sun with a spectrometer like CDS one can derive the intensity and velocity distribution of the O V 629 M-E line formed at approximately 230 000 K in AR8737. Pixels with Doppler shifts corresponding to a velocity greater than M-140 km/s is fully red/blue. Contours outline areas with velocities exceeding M-150 km/s. The velocities are calculated relative to the part of the solar disk (to the left) that is within the field of view.
 The movie shows doppler shifts over a period of time.
Animation:(1M)
The movie shows doppler shifts over a period of time.
Animation:(1M)From the CDS Operations Management Team in the Space Science & Technology Department at CCLRC Rutherford Appleton Laboratory Site maintained by John Rainnie. Last revised on Tuesday (17/Jul/2001) at 09:55. |