
 |
Newsletter |  |
|
Issue 1: 10th September 2001
A Note from the Editor and Contents Welcome to the first issue of the CDS Newsletter. The goal of this Newsletter is to inform the CDS user community of
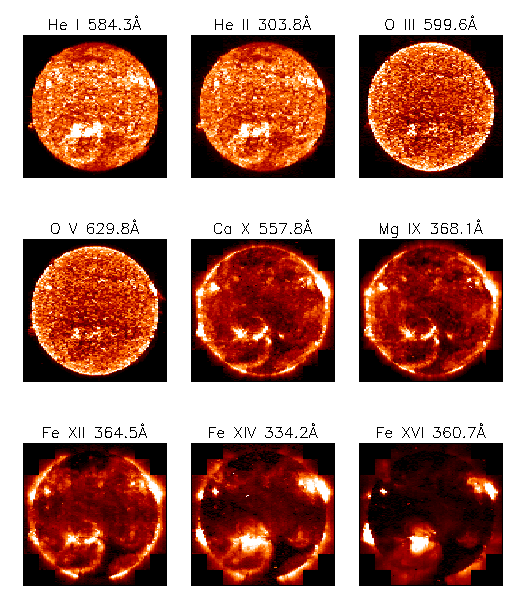
This Month's Topics: Measuring irradiance with CDS, and implications for the CDS calibration William Thompson Introduction The current calibration of the CDS Normal Incidence spectrometer is tied to two sounding rocket measurements made in 1997. A description of the current calibration used for CDS/NIS can be found at ../software/calibration.shtml Currently, the same calibration is used for both the data taken before SOHO's accident in the summer of 1998, and for the data taken after the accident. Coordinated observations with sounding rockets have also been taken after the accident, but the data is not yet available for comparison. The second-order calibration is not embedded within the software. For the second order lines of He II and Si XI at 304 A, I've been using an efficiency 25.9 times less than the corresponding first-order calibration, i.e. about 1.64e-5. One area where the calibration is important is in measuring the solar irradiance. Comparing the full disk irradiance measurements made by CDS against observations made by other instruments tests both the absolute calibration of CDS, and how well the calibration was maintained over that period. Observations Irradiance measurements have been made with CDS since March 1997, using the monthly study USUN_6. In order to make these measurements, 69 individual rasters are taken to cover the entire Sun. The entire spectral range in both NIS channels is brought down, so that the irradiance can be measured for every line observable by CDS. However, in order to be able to bring down this much data in a reasonable amount of time, a large amount of compression is needed. Two steps are taken to compress the data. One is to move the 4 arcsecond slit by 24 arcseconds between exposures, so that the Sun is undersampled by a factor of six. Although this means that the entire Sun is not observed, tests have shown that a representative enough sample of the Sun is taken, so that the result should be correct to within a few percent. The other method used to compress the data is to sum pixels along the slit. The first few observations added up all the pixels along the slit into a single number. Since then, pixels have been summed vertically in groups of four into larger pixels, so that low resolution images of the Sun can be built up, as in the following figure.  Comparison with other instruments There are two other instruments on SOHO which are also capable of measuring the solar irradiance in the same wavelength regime as CDS. One is the Solar EUV Monitor (SEM), which is part of the CELIAS package. SEM measures the integrated irradiance between 260-340 A. It takes three separate CDS components to match the SEM bandpass:
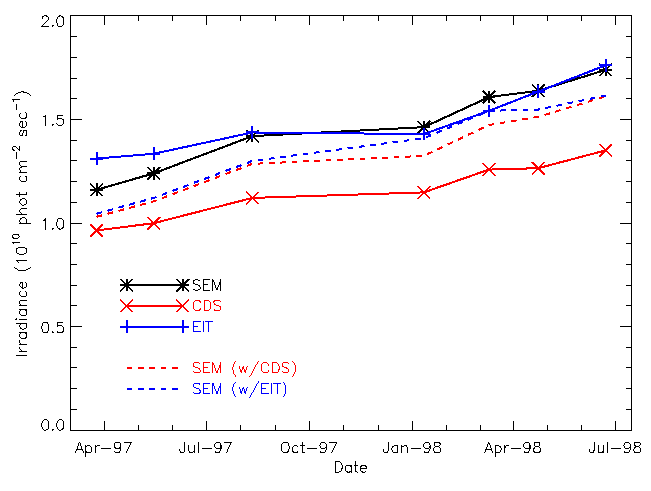
 Because the SEM instrument does not have a flat response over its bandpass, there is a certain level of interpretation which needs to be applied to the SEM data to convert them to physical units. In the above plot, the black line represents the results returned by the standard SEM software, using a constant reference spectrum. The colored dashed lines, on the other hand, represent the SEM results when the spectra of either CDS or EIT are used. The CDS irradiance is slightly lower than that measured by either SEM or EIT. When the CDS data is compared against the SEM results as modified by the CDS spectral response (the red dashed curve above), the CDS/SEM varies from about 95% at the beginning to 85% just before the accident. There is a slight downward slope to the ratio, which may indicate a small (10%) uncorrected loss of sensitivity in CDS. Since the uncertainty in the CDS irradiance values is about 25%, the CDS measurements agree with the SEM and EIT values within the error bars.
Post-recovery changes
When the ratio of the CDS irradiance (solid red) to the adjusted SEM data
(dashed red) is examined, it appears that there is a jump up just after the
accident to almost 100% of the SEM signal, followed by a slow drop back down to
85% again. From the CDS Operations Management Team in the Space Science & Technology Department at CCLRC Rutherford Appleton Laboratory Site maintained by John Rainnie. Last revised on Tuesday (22/Jan/2019) at 15:07. |