
|
Newsletter | |
|
Issue 13: 23 March 2006
Latest News Welcome to the CDS Newsletter. The goal of this Newsletter is to inform the CDS user community of
Happy 10th Anniversary, CDS!Contents:
Retirements & Staff Changes
We are sad to announce that three members of the CDS team at RAL, Jeff
Payne, Jim Lang and Barry Kent are retiring at the end of March.
SOHO 10th Anniversary Celebration was held at RAL on 2nd December
2005. The celebration consisted of a set of short talks describing
the history and results from SOHO. The audience included the press,
those involved in building hardware for SOHO in the UK,
representatives from the UK funding agencies, and representatives from
the wider solar physics community.
A special session to mark the 10th anniversary of the Coronal
Diagnostic Spectrometer will be held during the UK Solar Physics
meeting in Aberystwyth, 10-13 April 2006. The session will consist of
contributions from CDS users, presenting their favourite results
obtained from the CDS data over the entire SOHO mission.
The NASA Senior Review panel has approved the extension of the SOHO
funding until the end of 2009. The panel has also endorsed the plan of
a further extension for 2010 – 2014 in a scaled-down configuration
(LASCO coronagraph + European instruments). Application to ESA for
SOHO extension will be made in March and our application to PPARC for
the extension of the CDS funding is due by mid-September.
A CDS Users meeting took place in Abingdon, UK on 21 and 22
September 2005. The meeting included discussions of the recent science
results and highlights from CDS, exploration of the 9-year SOHO/CDS
data archive, updates on practical issues relevant to the CDS data
analysis.
As already reported at the 2005 CDS user meeting, during the last year
I have been carrying on a comprehensive analysis of CDS data during
the last 10 years, to extend the early in-flight calibration of all 9
CDS channels (Del Zanna et al. 2001, A&A, 379, 708-734). The main CDS
datasets considered are: NIS synoptic and full-Sun data, GIS spectral
atlases, complemented with data from other instruments. The
preliminary results are very encouraging, showing that all the CDS
channels have been remarkably stable over this long period. Several
adjustements are however needed. More information will soon be
available. I recommend a limited use of the wide slit in conjunction
with the NIS, considering the significant decreases in sensitivity due
to its use.
1. Introduction The GIS has recently been found to be in need of a tune-up. In particular, detector 1 has been producing spectra that are not good in several wavelength regions. In reality the GIS had been working so well, that the same parameter settings for the on-board processing have been in use for many years, and the voltages used were not increased, or very little. Now some changes are required. The best news is that the detectors are capable of excellent work still. It has been found that in many spectral lines the detector sensitivity did not significantly decrease since the start of the mission, although the spectral resolution has gone down. We have obtained new raw data for the quiet sun, slit 2, at the current settings in February. These are the first raw data taken since 2003. The GIS website http://www.mssl.ucl.ac.uk/www_solar/gis (located at MSSL) has also been refurbished. As a result, a new guide to GIS data is now available. Recently, the publications related to GIS were updated, and include now some of the early work on the detectors. The GIS pointing had been giving problems to some users, so an in-depth study was reported by me early January. The GIS has a systematic offset of 20.2 arcsec to the south (for normal roll angle =0) on top of the random uncertainty in the CDS pointing of 2-4 arcsec that was already known from NIS studies. 2. Status of the detectors and the implications For all four detectors raw data were obtained in February with the currently used quiet sun gset (66) voltages. Based on those data, the following conclusions can be made: detectors 3 and 4: These are the two longer wavelength regions. To tune the detector, we look for an optimum value for the pulse heigh distribution (PHA) of the whole detector of around 100-110 (out of 255). The current peak in the PHA seen in a recent quiet sun raw data transmission was around 70. That means that the detector does not work at 'top efficiency", but the effects may be too subtle to notice. The data continue to be good. detector 2: Detector 2 has a PHA dominated by the He 304 line and can therefore not be optimized in the same way as the other detectors. The detector continues to perform as before. detector 1: The detector voltage has fallen below the operating range. A new gset is being prepared. The wait is determined by the time to obtain raw data at higher voltage. So far the results show that the detector performs just as well as originally, exept for some strong spectral lines suffering from long term gain depression. In April a new gset (for quiet sun) will be installed. The active region gset update will be done next. For those interested, the raw data and gset fits can be seen on the GIS website. The following observations can be made of the new raw data. With the current settings, the spectral lines in part of the spectrum become very washed out and ghost into other spiral arms, making the data not useful. However, there are still some good wavelength ranges. The thinnest part of the spiral arms falls still within the gset encoding. So these spectral ranges are in principle useable throughout the past period. They are, generally speaking, the lines that did not show ghosting in the past. We still need to determine when the data became bad, but indications are that that occurred at or before mid 2005. More details will be published on our web page. http://www.mssl.ucl.ac.uk/www_solar/gis/GIS_status.html 3. A possible new approach The GIS has different gsets for different levels of activity, because the intensity incident on the detector has an effect on the pulse height distribution. In the data plane the radial positions of the spirals (and the intense lines) shift radially a little bit for high PHA. That is the reason that a different gset is needed for different activity levels. We are considering an approach to circumvent that problem, and details will be published on our website. 4. Long-term gain depression In 2003 a new study of long term gain depression was completed and the results of that study implemented in the GIS processing. The study was based on observed gain changes when varying detector voltages. Some questions remained, especially for quiet sun spectra. We find things that are generally known amongst GIS users, like the line width increase over time, but also that many lines show just small intensity changes. Only a few stronger lines have a larger loss in intensity. A report of our findings will be published soon, andmade available on the GIS main website. 5. GIS Support If you need GIS support, contact the GIS instrument scientist, Paul Kuin, at MSSL. His email is npmk@mssl.ucl.ac.uk or his solarmail ID is npkuin. His phone number is +44 (0) 1483-204295. 6. Links
User-contributed software Peter Young and John Rainnie
Do you have your own CDS analysis software that you'd like to share with others? Please send the routines to John Rainnie (j.a.rainnie@rl.ac.uk) and they will be made available on a special section of the CDS webpage. Following testing they will also be made available through the CDS tree in Solarsoft.
Using standard instrument software and two independently developed
data reduction and analysis procedures, we re-examine the accuracy of
plasma velocity information derived from data obtained by the Solar
and Heliospheric Observatory (SOHO) - Coronal Diagnostic Spectrometer
(CDS). We discuss only the O V 629 A line data obtained by the Normal
Incidence Spectrometer (NIS) and analyse a quiet Sun (QS) and active
region (AR) dataset. Using the QS data, we demonstrate that the
well-known North-South tilt in wavelength along the NIS slit varies
significantly with time, which is not accounted for in the standard
CDS correction procedures. In addition, when residual N-S trends exist
in the data after processing, they may not be detected, nor removed,
using the standard analysis software. This underscores the need for
careful analysis of velocity results for individual datasets when
using standard correction procedures. Furthermore, even when the
results obtained by the two independent methods are well correlated
(coefficients greater than 0.9), discrepancies in the values of the
derived Doppler velocities can remain 95% within +/-5 km/s. Therefore,
we apply the results to examine the velocities obtained for EUV
blinkers by previous authors. It is found that a strong correlation
exists in the patterns of variation of the blinker velocities >~0.98,
even though there may be differences in their magnitudes. That is, in
a clear majority of cases, the methods agree that a blinker is
red-shifted or blue-shifted, although the uncertainty in the absolute
velocity may be large.
We used three instruments (CDS, EIT, MDI) aboard the Solar and
Heliospheric Observatory spacecraft to observe the large sunspot in
NOAA Active Region 8539 on 1999 May 9 and 13. The spot contained a
bright plume, most easily seen in EUV emission lines formed at 5.2 <
log T < 5.7 (where T is the temperature in K), in its umbra on both
dates. The plume's differential emission measure (DEM) exhibited one
and only one broad peak centered around log T ~ 5.8 on May 9 and
around log T~ 5.6 on May 13, and exceeded the DEM of the quiet sun by
more than an order of magnitude at these temperatures. The high
temperature portion of the plume's DEM resembled that of nearby quiet
sun areas. Intensity ratios of the O IV lines at 625.8 A and 554.5 A
yield log n_e (where n_e is the electron density in cm^-3) of
9.6^+0.3_-0.6 in the plume on May 9 and 9.7^+0.2_-0.2 on May 13;
values of 9.4^+0.3_-0.9 and 9.4^+0.2_-0.3 were obtained in the quiet
sun areas on the same dates. Based upon abundance enhancements derived
from transition region emission lines of Ca, an element with low first
ionization potential, elemental abundances in the plume appear to be
coronal rather than photospheric. The plume plasma reveals a bipolar
Doppler velocity flow pattern, in which maximum downflows in excess of
37 km/s are observed in the northeast portion of the plume, and
maximum upflows that exceed 52 km/s are observed in the northwest.
We observed a transequatorial loop (TEL) connecting NOAA Active
Regions 10652 and 10653 at the west solar limb on 2004 July 29 with
the Extreme-Ultraviolet Imaging Telescope (EIT) and the Coronal
Diagnostic Spectrometer (CDS) aboard the Solar and Heliospheric
Observatory. Only the loop’s northern leg was observed with CDS. The
loop appeared bright and cospatial in extreme-ultraviolet emission
lines from ions formed over a wide range of temperature (T, in
kelvins), including He i (log T=4.0), O iii (log T=4.9), O iv (5.2), O
v (5.4), Ne vi (5.6), Ca x (5.9), Mg x (6.1), and Fe xii (log T=
6.1). This indicates that the loop plasma was multithermal and covered
roughly 2 orders of magnitude in temperature. Our measurement of He i,
O iii, and O iv line emission reveals the coolest plasma ever detected
in a TEL. The most likely explanation for the wide range of cospatial
temperatures in the TEL is that it consisted of numerous
sub-resolution strands, all at different temperatures. Each of the
lines that are formed at temperatures less than 10^6 K exhibited
relative Doppler blueshifts in the TEL that correspond to velocities
toward the observer larger than 30 km/s, where the two strongest cool
lines (He i at 584.3 and O v at 629.7 ) yielded maximum values of 37
and 41 km/s, respectively. The presence of cool plasma in the TEL at
heights several times those of the cool ions’ scale heights suggests
that the loop remained visible at low temperatures by maintaining a
steady flow of cool plasma.
We measure coronal magnetic field strengths of 1750 G at a height of
8000 km above a large sunspot in NOAA Active Region 10652 at the west
solar limb on 2004 July 29 using coordinated observations with the
Very Large Array, the Transition Region And Coronal Explorer, and
three instruments (CDS, EIT, MDI) aboard the Solar and Heliospheric
Observatory. This observation is the first time that coronal radio
brightness temperatures have been analyzed in a 15 GHz solar radio
source projected above the limb. Observations at 8 GHz yield coronal
magnetic field strengths of 960 G at a height of 12,000 km. The field
strength measurements combine to yield a magnetic scale height L_B =
6900 km. The radio brightness temperature maxima are located away from
a sunspot plume that appears bright in EUV line emission formed at
temperatures around several 10^5 K. We use the density-sensitive
emission line intensity ratio of O IV 625.8/554.5 to derive an
electron density n_e (in cm-3) of log n_e = 10.1 +/- 0.2 at the base
of the plume.
In this paper we present a further study of the M1 class flare
observed on October 22, 2002. We focus on the SOHO Coronal Diagnostic
Spectrometer (CDS) spectral observations performed during a
multi-wavelength campaign with TRACE and ground-based instruments
(VTT, THEMIS). Strong blue-shifts are observed in the CDS coronal
lines in flare kernels during the impulsive phase of this flare. From
a careful wavelength calibration we deduce upflows of 140 km/s for the
Fe~XIX flare emission, with a pattern of progressively smaller flows
at lower temperatures. Large line-widths were observed, especially
for the Fe~XIX line, which indicate the existence of turbulent
velocities. The strong upflows correspond to full shifts of the line
profiles. These flows are observed at the initial phase of the flare,
and correspond to the 'explosive evaporation'. The regions of the
blueshifted kernels, a few arc seconds away from the flare onset
location, could be explained by the chain reaction of successive
magnetic reconnections of growing emerging field line with higher and
higher overlying field. This interpretation is evidenced by the
analysis of the magnetic topology of the active region using a linear
force-free-field extrapolation of THEMIS magnetograms.
We present EUV (150-800 A) radiance measurements obtained with the
SOHO/Coronal Diagnostic Spectrometer (CDS) during the period from 1996
to 2003. We complement the CDS measurements with simultaneous
SOHO/EIT EUV images. We use the EIT center-to-limb variations to
obtain an estimate of the EUV spectral irradiance of the 'quiet Sun'
during 1996-2003. We discuss the evolution of the characteristics of
the solar corona from minimum to maximum, and show how it becomes
progressively hotter.
The solar extreme-ultraviolet (EUV, 150-800 Angstroms) irradiance is
one of the dominant factors in the formation of the ionosphere of the
Earth, via photo-ionisation. Yet, before the launch of the SOHO
satellite (1995), the only few reliable measurements at these
wavelengths were obtained in the 60's and 70's, mostly with rocket
flights. SOHO gives us the unprecedented opportunity to study in
detail the variations of the EUV spectral irradiance from minimum
(1996) to maximum (2001-2002) and beyond. We present here a
progress-report on a long-term plan to study the EUV spectral
irradiance and its characteristics. We use observations with the
Coronal Diagnostic Spectrometer (CDS) and the EUV Imaging Telescope
(EIT) to present the EUV irradiance at selected wavelengths and
characterise the contributions of the different solar regions along
the solar cycle.
Highlights for CDS users:
Oscillations have long been observed in the sunspot umbral
chromosphere and transition region, connected to global p-mode
oscillations. These p-modes are thought to undergo mode conversion to
slow magneto-acoustic waves in regions of strong magnetic field. More
recently, propagating oscillations have also been observed in solar
coronal loops. Using new spectroscopic imaging data at transition
region temperatures, combined with coronal imaging, we present direct
observations of the propagation of these slow magneto-acoustic p-modes
through the transition region and into the solar corona, along the
magnetic field. The waves are observed as oscillations in the
chromosphere/transition region and propagations in the corona due to
the emission scale height of the different temperature lines, combined
with the magnetic field geometry.
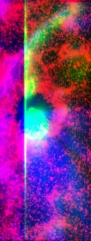
Figure : Composite TRACE 1600 A (Red), CDS O V (Green), and
TRACE 171 A (Blue) image of sunspot AR 10570 on 2004 March 12. TRACE
1600 shows the penumbral boundary, O V shows the bright transition
region emission of the sunspot plume and TRACE 171 shows the coronal
magnetic loops. The spatial coincidence of the umbra, sunspot plume,
and emerging coronal loop system is clearly apparent. A plasma flow is
also visible, originating from just outside the eastern edge of the
field of view.
Simultaneous observations of explosive chromospheric evaporation are
presented using data from the Reuven Ramaty High Energy Solar
Spectroscopic Imager (RHESSI) and the Coronal Diagnostic Spectrometer
(CDS) onboard SOHO. For the first time, co-spatial imaging and
spectroscopy have been used to observe explosive evaporation within a
hard X-ray emitting region. RHESSI X-ray images and spectra were used
to determine the flux of non-thermal electrons accelerated during the
impulsive phase of an M2.2 flare. Assuming a thick-target model, the
injected electron spectrum was found to have a spectral index of ~7.3,
a low energy cut-off of ~20 keV, and a resulting flux of >=4x10^10
ergs cm^-2 s^-1. The dynamic response of the atmosphere was determined
using CDS spectra, finding a mean upflow velocity of 230+/-38 km s^-1
in Fe XIX (592.23A), and associated downflows of 36+/-16 km s^-1 and
43+/-22 km s^-1 at chromospheric and transition region temperatures,
respectively, relative to an averaged quiet-Sun spectra. The errors
represent a 1 sigma dispersion. The properties of the accelerated
electron spectrum and the corresponding evaporative velocities were
found to be consistent with the predictions of theory.
Using temporal series data from the Coronal Diagnostic Spectrometer
(CDS) on SOHO, we study oscillations found in radiant flux and
velocity measurements from transition region and coronal spectral
lines. We use Fourier techniques to measure phase delays between flux
(`intensity') oscillations and between velocity oscillations of
different transition region-corona and corona-corona line pairs. We
also measure the phase delays between flux and velocity oscillations
(I-V). The phase delays measured between different line pairs, when
plotted over a -180 degree to +180 degree range, line up along
diagonal lines corresponding to measurable and fixed time delays. The
slopes of these diagonal lines suggest the outward propagation of
waves. Using the measured time delays, we estimate propagation speeds
for the different line pairs that indicate that the waves producing
the observed phase delays are magnetoacoustic waves propagating at
speeds close to the sound speed. In addition, we find that the phases
occur at fixed integer frequencies of f/4 (90 deg) and 3f/16 (67.5
deg), instead of the expected interval of f (360 deg), indicating that
a `Doppler effect' is acting on the waves, perhaps due to some form of
resonant cavity at coronal temperatures. From I-V measurements, we
find evidence for fast magnetoacoustic waves to be predominantly
present at coronal temperatures, while at transition region
temperatures slow magnetoacoustic waves are more common.
Major features include:
The paper presents an integrated view of the population structure and
its role in establishing the ionization state of light elements in
dynamic, finite density, laboratory and astrophysical plasmas. There
are four main issues, the generalized collisional–radiative picture
for metastables in dynamic plasmas with Maxwellian free electrons and
its particularizing to light elements, the methods of bundling and
projection for manipulating the population equations, the systematic
production/use of state selective fundamental collision data in the
metastable resolved picture to all levels for collisonal–radiative
modeling and the delivery of appropriate derived coefficients for
experiment analysis. The ions of carbon, oxygen and neon are used in
illustration. The practical implementation of the methods described
here is part of the ADAS Project
Observational evidence for gentle chromospheric evaporation during the impulsive phase of a C9.1 solar flare is presented using data from the Reuven Ramaty High-Energy Solar Spectroscopic Imager and the Coronal Diagnostic Spectrometer on board the Solar and Heliospheric Observatory. Until now, evidence for gentle evaporation has only been reported during the decay phase of a solar flare, where thermal conduction is thought to be the driving mechanism. Here we show that the chromospheric response to a low flux of nonthermal electrons >=5x10^9 ergs cm^-2 s^-1 results in plasma upflows of 13+/-16, 16+/-18, and 110+/-58 km s^-1 in the cool He I and O V emission 13+lines and the 8 MK Fe XIX line. These findings, in conjunction with other recently reported work, now confirm that the dynamic response of the solar atmosphere is sensitively dependent on the flux of incident electrons.
|