
|
Newsletter | |
|
Issue 10: 17 September 2003
Latest News Welcome to the CDS Newsletter. The goal of this Newsletter is to inform the CDS user community of
This Month's Topics:
SPECIAL UPDATE: a message from Richard Harrison 19 September 2003 Dear All, As you may know, I have now taken on the role of Space Physics Division Head at RAL. I now oversee the projects in STP, planetary physics, astrophysics as well as solar physics. Of course, I will attempt to retain some of my research activities and project responsibilities. However, after 17 years on the SOHO Project, with 11 years as PI for CDS, I have decided that I must step down. It would be foolish of me to pretend that I can retain all of my project responsibilities - and it would be bad for SOHO to have a non-functioning PI! So, as from September 1st, Andrzej Fludra, who was already Deputy PI and Project Scientist, formally took over as PI. With Jeff Payne and Dave Pike continuing in their roles, and the inclusion of Peter Young as Project Scientist, I know that we have the 'A-team' for CDS at RAL; it is in capable hands. I started on CDS in 1986, when Bruce Patchett (PI), Eric Sawyer (Project Manager) and I (Project Scientist), coordinated the proposal to ESA and PPARC. In 1992, Bruce moved into the commercial arm of RAL, and I took over the PI role. All along, we have had a wonderful Co-I team, and an instrument/operations team that I have been tremendously proud to work with. I find it impossible to imagine a better group of people to run an instrument, and I really feel that we have provided an excellent facility for the solar community, and one which is exploited to the full. Saying this, I include not only the core team from RAL, but also the CDS teams from MSSL, Goddard and Oslo - and the CoI team. It has been a great collaboration and I thank you all for the experience. You will all still see me around - at SOHO Workshops etc... - because SOHO is still important to me! Thanks again, All the best, Richard Professor Richard A. Harrison Head of Space Physics Division Rutherford Appleton Laboratory Chilton, Didcot Oxfordshire OX11 0QX, UK Tel: (44) 1235 44 6884 Fax: (44) 1235 44 5848 New Principal Investigator and Project Scientist Congratulations go to Richard Harrison on taking up the Division Head role for the Space Physics Division at RAL from 1 September. Due to the increased responsibilities and demands of the new position, Richard has decided to hand on the CDS PI role and so, from 1 September, the new Principal Investigator for CDS is Andrzej Fludra. The role of Project Scientist moves from Andrzej to Peter Young. The rest of the CDS team is unchanged and their expert services remain available to all users. Together, we will continue the CDS operations with a goal of providing the highest quality data to all CDS users. Please continue sending your observing requests to Andrzej (A.Fludra@rl.ac.uk). For advice on defining your studies and other instrumental matters, please contact Peter Young (P.R.Young@rl.ac.uk). This is a historic moment for the CDS project - Richard has been PI for 11 years, and a key player on the CDS team for the past 17 years, contributing enormously to the success of CDS. In our minds, his name is inseparably linked with the CDS. On behalf of the whole CDS team we thank Richard for all his hard work and enthusiastic, dedicated leadership, and wish him all the success in his new endeavours. Richard intends to stay involved in solar physics research and will, in his new position, be instrumental in developing future solar projects. Best of luck, Richard! Joint Observations of Propagating Oscillations with SOHO/CDS and TRACE M.S. Marsh, R.W. Walsh, I. De Moortel, and J. Ireland (A&A, in press)
Joint Observing Program (JOP) 83 Solar and Heliospheric
Observatory/Coronal Diagnostic Spectrometer (SOHO/CDS) and Transition
Region and Coronal Explorer (TRACE) data is analysed for evidence of
propagating intensity oscillations along loop structures in the solar
corona. A propagating intensity oscillation with a minimum estimated speed
of 50-195 km/s is observed within a TRACE 171A coronal loop using a
running difference method. Co-spatial and co-temporal CDS and TRACE
observations of this loop are analysed using a wavelet analysis method.
The TRACE data shows a propagating oscillation with a period of
approximately 300 s. This period is also observed with CDS suggesting
propagating oscillations at chromospheric, transition region and coronal
temperatures in the He I, O V and Mg IX lines.
This study focuses on the diagnostic capabilities of the
TRACE and SOHO-CDS instruments to describe the physical
characteristics of quiescent solar active regions.
In particular we concentrate on the 1 MK loops, best seen in the
TRACE EUV 173 A passband. These are high-lying structures
which can remain stable over timescales of hours to days.
We present simultaneous observations of off-limb active region 1 MK loops
performed with TRACE (173 A and 195 A bands) and the SOHO-CDS.
The CDS spectral capabilities complement the TRACE observations well
and allow an in-depth study of the plasma properties.
Some important new results are presented here.
In terms of cross-field characteristics, we find that
these loops are isothermal and much cooler (T ~ 0.7-1.1 10^6 K) than the surrounding diffuse high-lying active region
emission ($T ~ 2 10^6 K).
We show that the diffuse background-foreground constitutes the bulk
of the high-lying quiescent active region emission.
We explain some of the discrepancies found by various authors
(based on SOHO and TRACE observations) with
an overestimation of loop temperatures and densities. This was
caused by inaccurate or neglected background subtraction in the data analysis.
We studied the leg of a 1 MK loop and found that along its length
temperatures and densities have steeper profiles compared to those derived from
previous studies based on TRACE observations.
The observations are consistent with
an element abundance FIP effect of about 4, filling factors close to unity,
and a constant density across the loop.
We find a remarkable consistency between the CDS and
TRACE observations, although we also find severe limitations to the use of TRACE
diagnostic techniques.
On-disc SOHO and TRACE observations of the footpoints
of 1 MK quiescent loops in a solar active region are presented.
These types of loops are long-lived and high-lying
features that are best seen in the TRACE 173 A passband,
sensitive to 1 MK temperatures.
SOHO/CDS data are used to show the clear association
between the high-lying 1 MK coronal emission and
emission formed at lower heights and temperatures, in the
transition region.
The 1 MK loops are rooted in strong unipolar regions located
at the supergranular network boundaries.
These loops have near-isothermal
distributions at each location along their length, with peak emission
measures at T= 0.7 MK, where electron densities are ~ 2 10^9 cm-3.
The loops showed photospheric abundances,
at odds with previous results based on Skylab data.
A number of changes have been made to the GIS analysis software, and calibration files, which are briefly summarised here, and included in revised copies of the GIS Analysis and Instrument guides : ghost_buster, has been revised to automatically restore the counts of some unblended ghosted lines back to their original location. An example of this is illustrated in the following figure :
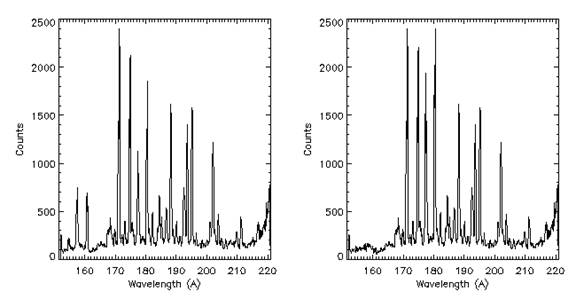 Figure 1: Ghost_buster automatic restoration of ghosts. (Left) uncorrected averaged smoothed spectrum. (right) The same spectrum corrected using ghost_buster in automatic mode. This works well for quiet sun observations, restoring almost all lines. The $CDS_GIS_CAL_INT directory, contains the revised flat field files have been generated to correct for LTGD. Because of the size of the corrections (as much as 60%) and associated uncertainty, a pixel by pixel error array is now included in the calibrated qlds structure. This can be extracted using the gis_error function
gis_calib, by default the data will be returned in calibrated units of
photons/sec/arcsec2/cm2.
New RoutinesGIS_FIT uses predefined cfit structures to automatically fit most regions of the GIS spectra.
This routine works on calibrated and uncalibrated data. Un- calibrated data is corrected and calibrated automatically using the individual routines described in the previous sections of the analysis guide (Gis_smooth, Ghost_buster, gis_calib etc). The visible identified lines are then fitted, using the cfit line fitting routine. The output structure contains the fitted line positions, widths, intensities, errors, and total line counts in photons/sec/arcsec2, along with ancillary data such as the location and time of observation. The gisfit structure can be used to quickly produce light curves, images and DEM maps GIS_UTPLOT To display a quick time series of data acquired with GIS you can use the routine gis_utplot. This is a wrapper to the Solarsoft utplot program, which displays a time series of the data acquired. To call:
This plots a time series of the raw accumulated counts for the selected detector (see Figure 2):
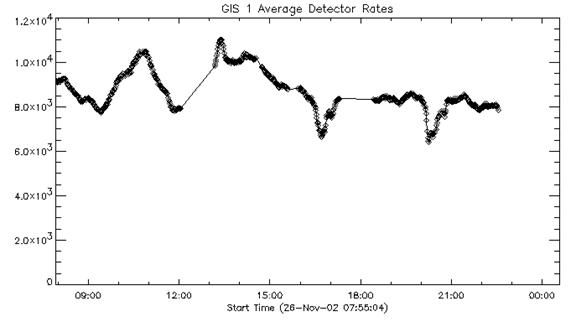
Figure 2: The output from gis_utplot, for a series of sit and stare observations in an active region located at the limb. Note the dimming periods around 17:00 and 20:00 UT. This is investigated in Figure 7 where individual lines are plotted. This routine also works with arrays of qlds structures. So if you have a series of qlds from a particular observation you can combine these in the following way:
Or alternatively a string array of program numbers for example:
This will read, correct, calibrate and then plot the data, In this case from a sit and stare observation which is displayed in Figure 6. The calibrated and fitted data is saved into the gisfit structure if this variable is passed on the command line. If it already exists it is updated. The gisfit structure can then be used to plot the corrected, calibrated and fitted lines from the observations.
Calling gis_utplot in this fashion will result in a prompt for you to select a particular line from a list of available present in the structure to plot. Alternatively, the specific line id can be entered.
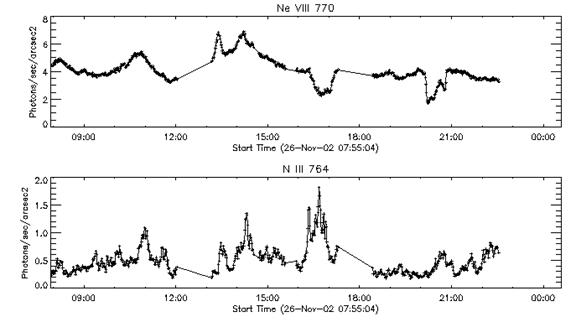
Figure 3: Output from gis_utplot, for specific lines contained in
the gisfit structure.
|