|
Newsletter | |
|
Issue 12: 12 January 2005
Latest News HAPPY NEW YEAR! Welcome to the CDS Newsletter. The goal of this Newsletter is to inform the CDS user community of
Contents:
Dave Pike's Retirement
We are sad to announce that Dave Pike is taking an early retirement and leaving RAL, and the CDS project on 14 January 2005. Dave has been with the CDS since 1992, leading the development of the CDS software, expertly managing the CDS data and helping many of us with his personal advice on all aspects of data analysis. It is hard to imagine the CDS project without him. On behalf of the CDS team and CDS users worldwide we thank Dave for all his contributions and wish him the best of luck in his new endeavours.
The next CDS Users meeting will take place in Abingdon, Oxfordshire, on 21 and 22 September 2005. We will review progress in CDS data analysis, new results, and discuss novel applications of CDS data and collaborations with new solar missions.
Everyone is welcome to attend. The details on travel, accommodation and the meeting programme will be sent later.
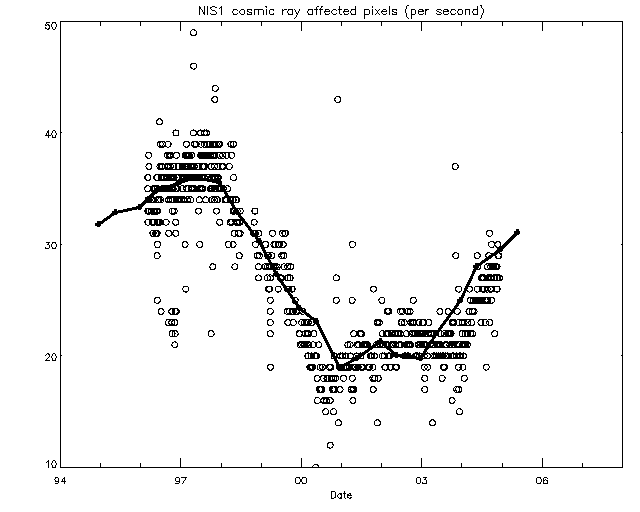
It is well known that the number of non-solar cosmic rays in the inner solar system is anti-correlated with the strength of the solar radial field - in other words with solar cycle activity. It is also apparent to users of CDS data that the NIS detector is affected by particles. This is particularly obvious during solar proton storms, but there is also a steady background contamination. Usually these events are a nuisance and the images must be cleaned by the various standard CDS routines available. On the other hand, given a long and uniform dataset, it is possible to use the cleaning algorithms as a means of counting the number of events over time. One suitable dataset is that of the study NISAT_S, which is used regularly to create an archive of full-spectral NIS coverage. In the diagram below, we have plotted the rate at which CCD pixels in the NISAT_S exposures have been affected by cosmic-ray hits throughout the mission. A variation of a factor of two during the solar cycle is clear. Superimposed on the cosmic-ray data is a qualitative depiction of the sunspot count during the current cycle. It is qualitative because, as well as inverting the variation, both the sunspot count amplitude and zero-point have been adjusted to illustrate similarities with the cosmic ray data. Crucially also the two datasets have been offset in time by one year. The delay between sunspot numbers and radial field intensity is also apparently a well-documented feature. Even though it appears that some scaling of the time axis would be required to create the optimum correspondence with sunspot numbers, it seems that the NIS cosmic-ray counts are able not only to serve as a proxy for the general solar magnetic variation in the cycle, but are also sensitive enough to detect smaller features such as the double peak of the current cycle.
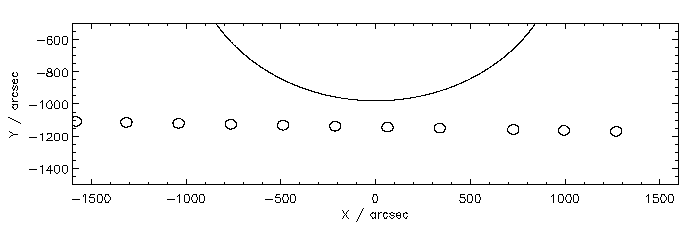
A transit of Venus across the face of the Sun occurred on 8 June 2004, the first time for 121 years. From SOHO's position in orbit around the L1 Lagrange point, however, Venus missed the disk and crossed only the off-limb corona, going over the south pole (Figure 1). Thus, in order to see the 'transit' with CDS it was necessary to look for Venus against the background of the faint off-limb corona rather than the bright disk.
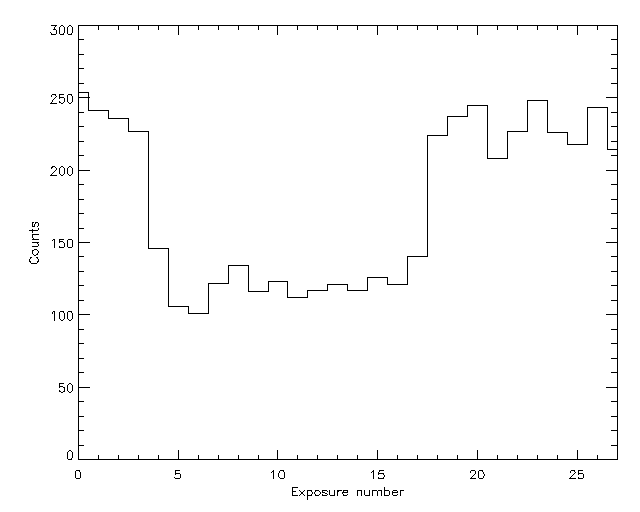
Since the coronal lines in NIS are faint relative to the strong cool lines (He I 584, O V 629) in which the previous year's Mercury transit was seen (see CDS Newsletter No. 9), it was decided to make use of the GIS as well as NIS for the observation. The astigmatic nature of GIS means that images are not possible, but this is compensated by the high sensitivity in coronal emission lines, particularly the group of iron lines between 170-210 angstroms. Venus was 60" in diameter from SOHO's position and its movement across the sky quite rapid at 4"/minute. The observing sequence was thus set to use fixed slit positions, allowing Venus to roll under the slit. The light curve produced from repeated 1 minute exposures should then show a dip in the number of photons for around 15 minutes as Venus passed through the slit. An alternating sequence was used such that GIS observed first for 30 mins and then the pointing was corrected using the scan mirror to allow NIS to observe Venus for 30 mins. CDS was then re-pointed, and the GIS-NIS sequence repeated. In total there were 11 re-pointings over a 12 hour period.
Venus was clearly detected in the 5th pointing with a light curve formed from the GIS spectra showing a depression of around 50 % over a 15 minute interval (Figure 2). Venus was observed by GIS in all subsequent pointings, the later pointings aided by the presence of a bright streamer on the SW limb. No clear indication of Venus in the NIS data was found, but detailed processing may eventually reveal something.
In all, the Venus transit proved successful for CDS and demonstrated
the excellent properties of GIS when used off-limb.
Thomas Ormston, a 4th year Birmingham University student, is spending his final year with the
solar group at RAL, working on his MSc thesis in Physics and Space
Research. Tom has been analysing CDS observations of the Mercury
transit from 2003 to derive the NIS spatial point spread function. A summary of
his preliminary activities to date is on the following website:
Blinkers are brightenings at network cell junctions that are traditionally
identified with SOHO/CDS and explosive events or high velocity events
are identified in high resolution UV spectra obtained from HRTS and
SOHO/SUMER. Criteria are determined to facilitate objective automatic
identification of both blinkers and explosive events in both SOHO/CDS and
SOHO/SUMER data. Blinkers are identified in SUMER data, if the temporal
resolution of the data is reduced to that of CDS. Otherwise short lived,
localised intensity enhancements that make up the blinker are identified.
Explosive events are identified in CDS data when the line width is
significantly increased, and occasionally if there is an enhancement in
the wing of the line profile. A theoretical statistical model is presented
which hypothesises that blinkers and explosive events are random and not
connected in any way. The results given in this paper suggest that this
hypothesis can not be rejected and our probability interpretation of the
recent results of Brkovic (2004} are inconclusive.
The results of simultaneous observations
of oscillations in the chromosphere, transition region,
and corona above nine sunspots are presented.
The data are obtained through coordinated observing
with the Solar and Heliospheric
Observatory - SOHO and the Transition
Region And Coronal Explorer - TRACE.
Oscillations are detected above each umbra.
The power spectra show one dominant frequency corresponding
to a period close to 3 min.
We show that the oscillations in the sunspot transition
region can be modeled by upwardly propagating acoustic waves. In the corona the oscillations
are limited to small regions that often coincide with the endpoints of sunspot coronal loops.
Spectral observations show that oscillations in the corona contribute to the observed
oscillations in the TRACE 171 A channel observations. We show that a recent
suggestion regarding a connection between sunspot plumes and 3~min oscillations
conflicts with the observations.
We present EUV and X-ray light curves and Doppler velocity measurements for a GOES class M2 solar flare observed in NOAA Region 9433 on 2001 April 24 at high time resolution with the Coronal Diagnostic Spectrometer (CDS) aboard the Solar and Heliospheric Observatory (SOHO) satellite (9.83 s), and the Bragg Crystal Spectrometer (BCS) and Hard X-ray Telescope (HXT) aboard the Yohkoh satellite (9.00 s). Coordinated imagery with SOHO's Extreme-ultraviolet Imaging Telescope (EIT) and the TRACE satellite reveal that the CDS slit was centered on the flare commencement site; coordinated magnetograms from SOHO's Michelson Doppler Imager (MDI) are consistent with this site being the footpoint of a flare loop anchored in positive magnetic field near the outer edge of a sunspot's penumbra. CDS observations include the preflare quiescent phase, two precursors, the flare impulsive and peak phases, and its slow decline. We find that (1) the average wavelengths of O III, O IV, O V, Ne VI, and He II lines measured during the preflare quiescent phase are equal (within the measurement uncertainties) to those measured during the late decline phase, indicating that they can be used as reference standards against which to measure Doppler velocities during the flare; (2) the EUV lines of O III, O IV, O V, and He II exhibit upflow velocities ~40 km/s during both precursor events, suggestive of small-scale chromospheric evaporation; (3) the Fe XIX EUV intensity rises and stays above its preflare noise level during the second (later) precursor; (4) the maximum upflow velocities measured in Fe XIX with CDS (64 km/s) and in Ca XIX (65 km/s) and S XV (78 km/s) with BCS occur during the flare impulsive phase, and are simultaneous within the instrumental time resolutions; (5) the Fe XIX EUV intensity begins its impulsive rise nearly 90 s later than the rise in intensities of the cooler lines; (6) hard X-ray emission arises nearly 60 s after the cool EUV lines begin their impulsive intensity rise; (7) the EUV lines of O III, O IV, O V, and He II exhibit downflow velocities ~40 km/s during the flare impulsive phase, suggesting momentum balance between the hot upflowing material and the cool downflowing material. Our observations are consistent with energy transport by nonthermal particle beams in chromospheric evaporation theory.
We observed a large sunspot in NOAA Region 9535 on 2001 July
12, 15, 17, and 19 with three instruments (CDS, EIT, MDI) aboard
the Solar and Heliospheric Observatory satellite. EUV
emission lines of O IV (formed at logarithmic temperature of 5.2),
O V (5.4), Ne IV (5.2), Ne V (5.5), Ne VI (5.6), Ne VII (5.7), and
Ca X (5.9) revealed a large bright plume within the sunspot
penumbra on July 12 and 15, a smaller, dimmer plume on July 17,
and no plume on July 19. Downflows of 25 km/s or more
were measured within the sunspot plume on July 12 and 15. By
July 17 the downflow area had shrunk in size, the downflows had
diminished in magnitude, and upflows were measured in the umbra
and parts of the penumbra outside the plume. By July 19
downflows were no longer observed, but had been replaced
entirely with upflows of 15 - 25 km/s in the umbra and
portions of the penumbra. This is the first time that the
disappearance of a sunspot plume has been observed to occur
simultaneously with a dramatic change in flow velocity pattern in
the sunspot plume and umbra. On July 12 upflows northeast of
the sunspot were observed along with the downflows in the
plume. Electron density measurements based upon intensity
ratios of the O IV lines at 625.8 A and 554.5 A indicate a
significantly greater value in the upflow zone than in the plume,
consistent with siphon flow as the driver of the observed
velocities; however, the line at 625.8 A is very weak and
blended in the red wing of the Mg X line at 624.9 A, so
derived densities are highly uncertain.
|