
 |
Engineering |  |
|
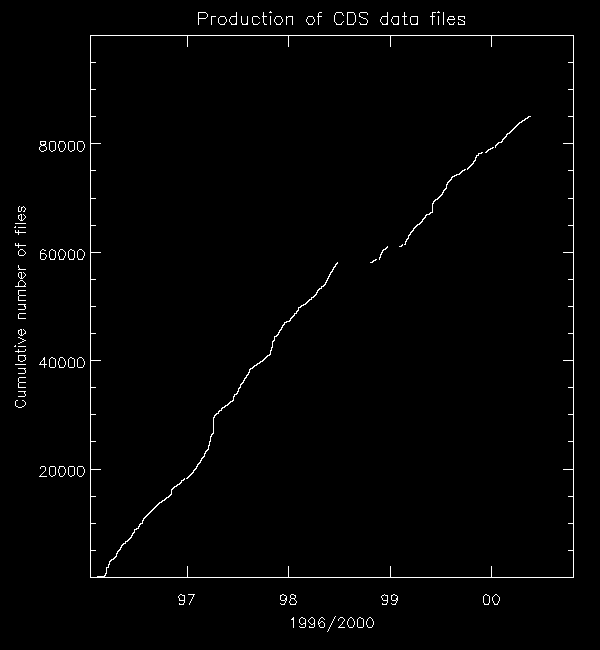
Data file creation This plot shows the rate at which CDS data files are being created. The regions of steep gradient are times when a substantial number of movie or "sit and stare" type observations are made. The plateau at about 60,000 files was caused by the temporary loss of SOHO. 
From the CDS Operations Management Team in the Space Science & Technology Department at CCLRC Rutherford Appleton Laboratory Site maintained by John Rainnie. Last revised on Thursday (24/Apr/2008) at 15:46. |