

 |
Engineering |  |
|
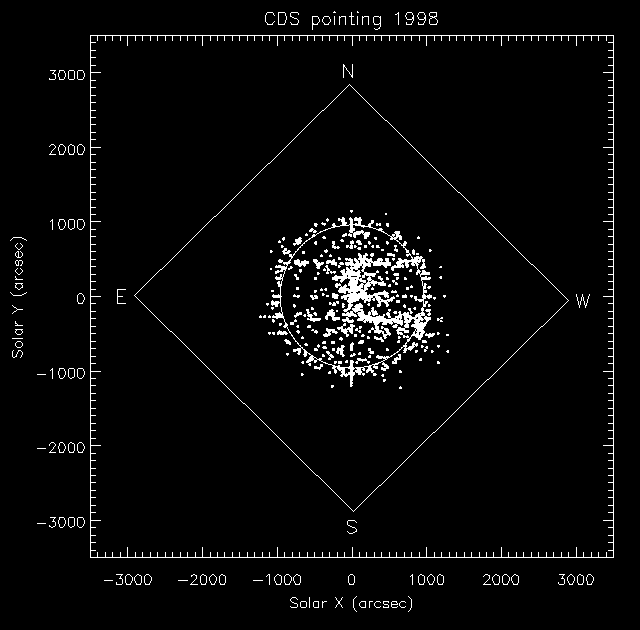
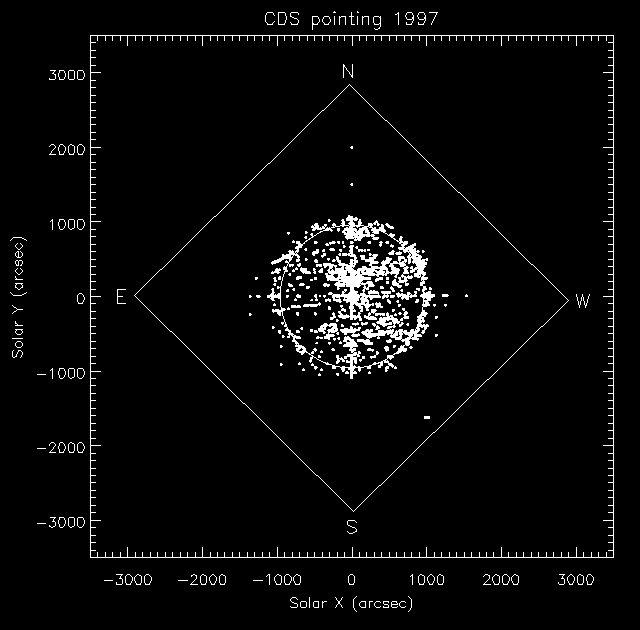
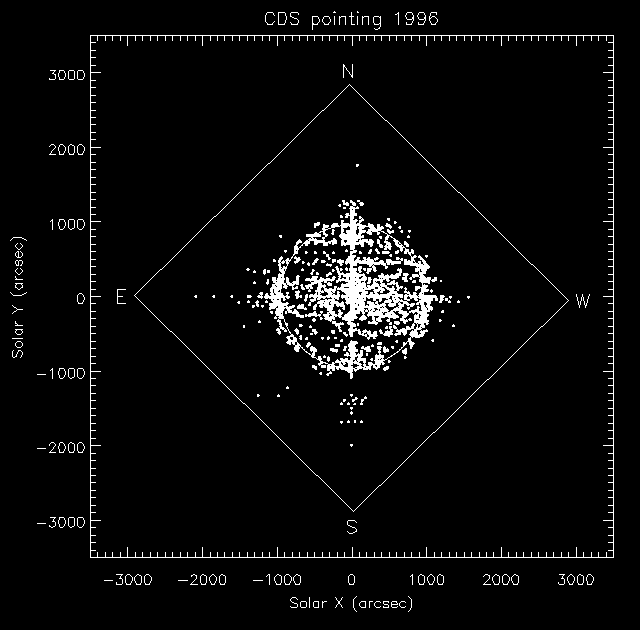
Pointings This plot show the location of the centre of all individual studies that have been run by CDS 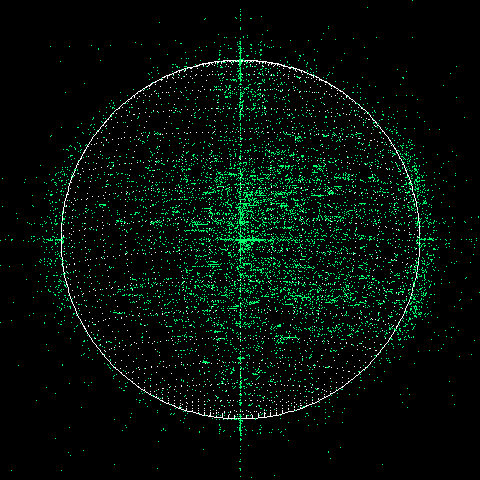 This plot shows the frequency with which different regions of the sun have been studied. Lighter colored areas have been the subject of more studies then darker colored areas. 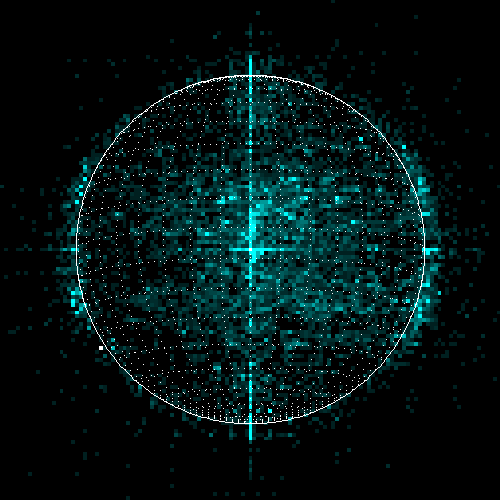 These plots show the location of the centre of all rasters observed by CDS.to 18th May 2000. 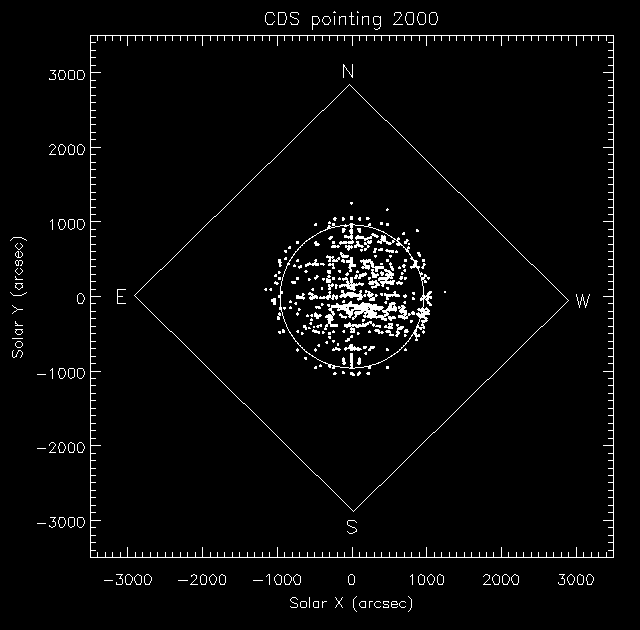
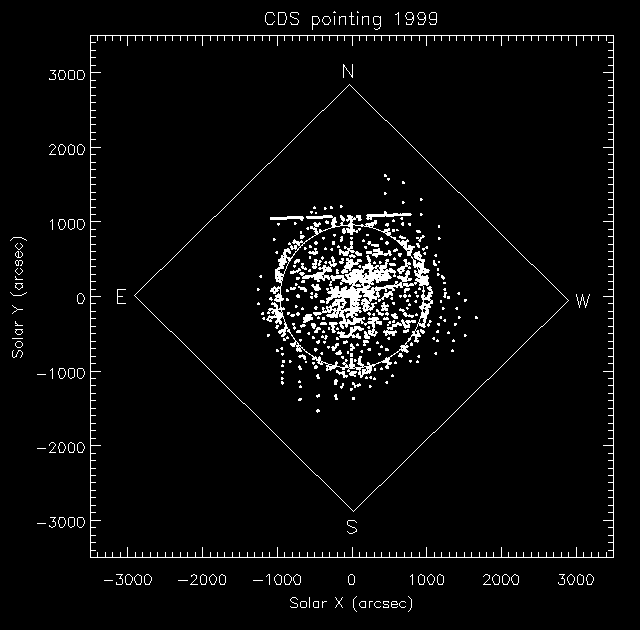
From the CDS Operations Management Team in the Space Science & Technology Department at CCLRC Rutherford Appleton Laboratory Site maintained by John Rainnie. Last revised on Thursday (24/Apr/2008) at 15:39. |