|
|
Issue 4: 12th December 2001
A Note from the Editor and Contents
Welcome to the CDS Newsletter. The goal of this
Newsletter is to inform the CDS user community of
- current CDS science topics
- developments in CDS data analysis
- instrumental matters
- operational issues
The Newsletter is updated monthly. We invite your contributions on CDS-related matters: data analysis, science results, instrument calibration, software and questions on these topics. Your responses will influence the content of future issues. Please send newsletter inputs and correspondence to: fludra@cdso8.nascom.nasa.gov
This Month's Topics:
Quiet Sun Workshop Summary
Clare Parnell
Recently a workshop entitled 'The Quiet Sun: Transient Events and Coronal
Heating' was held at MEDOC in Paris. Approximately, 25 known participants
attended although on the first day we started off with a few extras! The
aim of the meeting was to understand the relationships between the many
reported quiet Sun transient events, e.g. explosive events, network
flares, blinkers, etc. In particular, to determine whether all these types
of phenomena are just manifestations of the same event detected by different
techniques in different wavelength bands, or whether they are
fundamentally different? To do this participants were encouraged to
analyse particular named data sets. Each of the named data sets contained
CDS data. Furthermore, since CDS can observe in chromospheric, transition
region and coronal wavelengths it was particularly useful for comparing
observations in these regions.
The results from the workshop strongly suggest that the SOHO/CDS EUV
transient brightenings, blinkers, network and cell brightenings are all
the same phenomena just observed using wide slit, rastered and single slit
data, respectively. However, various members of the workshop have agreed
upon a strategy to confirm (or deny) this.
There was also an animated discussion as to whether CDS blinkers were
simply made up of many SUMER brightenings and SUMER explosive events. There
was certainly some evidence that this may well be the case and work has
started to find specific cases where a CDS blinker occurs directly above
an explosive event observed in SUMER. Although there was a good data set
where both SUMER and CDS were observing the same area, the SUMER slit,
which was longer than the CDS slit, showed its greatest activity outside
the CDS field of view!
A number of other discussions took place covering jetting phenomena and
network flares/heating events/nanoflares. Further details of the workshop
and the conclusions can be found
on the following website.
Solar Cycle Observations with SOHO CDS - Implications for
Coronal Heating
Carl Foley
A widely used diagnostic tool for coronal heating enthusiasts has been the measurement of the
coronal temperature, and its variation with height in the corona and along
coronal loops. Previous work has generally found that the coronal temperature increases as
a function of height above the limb and along
the loops. This has demonstrated a requirement for heating up to and
including the maximum observed height range of almost 2 solar radii.
More recently Aschwanden
& Nitta., (2000) have demonstrated that heating at heights above
the first gravitational scale height (a few x 10Mm) is not required, and the
observed positive temperature gradient may simply be a result of the superposition
of many flux tubes of different temperature which are heated at their base.
CDS now allows us to view the relative distribution of individual ions as function of height in
the corona. This enables us to examine the distribution of plasma in many regions and
structures. The Grazing Incidence Spectrometer (GIS) of CDS is operated in a photon
counting mode. This allows events to be discriminated by pulse height, thereby allowing cosmic ray hits to
be excluded from the accumulated spectra. The GIS is therefore able to
obtain deep exposures relatively free of cosmic ray background far off limb.
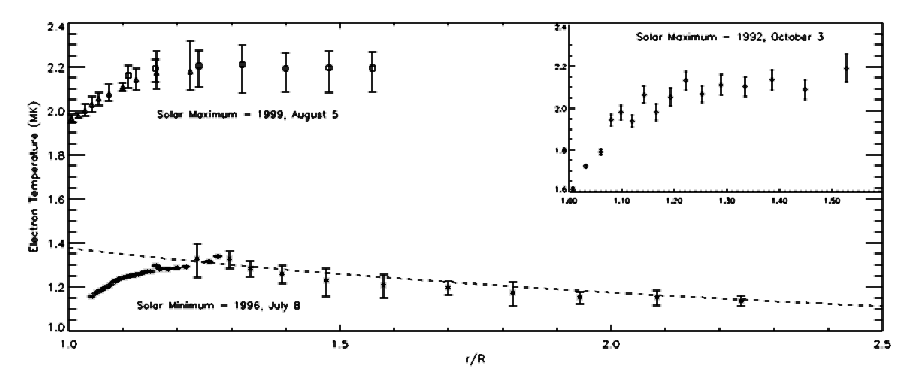
In a recent paper (A&A in press) Foley, Patsourakos, Culhane, & Mackay 2001 we evaluate the
relative abundance of Fe IX through Fe XV ions for coronal streamers observed close to the solar
minimum and maximum of the current solar cycle (23), on 1996 July 8 and
1999 August 5 respectively. The most abundant (adjacent in Te) ions were
then used to establish the best representation of the apparent temperature profile with height.
The derived temperature profile and its variation from solar minimum to
maximum are used to infer how the corona evolves and its associated energy
requirements. For comparison we have also included solar maximum data for
cycle 22 (1992, October 3) obtained from Yohkoh observations which were the
basis of Priest et al., 1998, 2000.
A figure from this paper is displayed below and highlights the difference in
the coronal temperature between solar minimum and maximum.
 The temperature of the cores of coronal streamers over the solar
cycle.
Using SUMER data, Schuhle
et al. (2000), found that the emission from the transition region (TR) increased by a factor of 2 from solar minimum to solar maximum.
Classical models of the Transition region for the quiet Sun (e.g., Gabriel 1976)
indicate that TR radiative losses are powered from the coronal conductive flux from the overlying corona.
The enhanced transition region emission reported by Schuhle et al. (2000)
is consistent with the increase of the coronal temperature over the solar
cycle which we observe and present here.
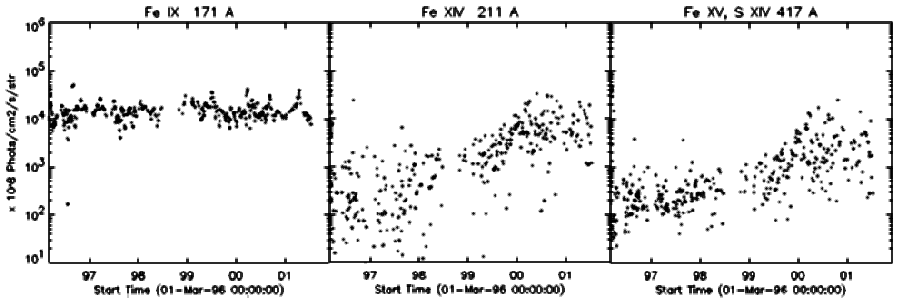
 Evolution of the sun in the EUV as recorded by the
FSUN observations over the rise of the current solar cycle
The variation of the Sun's irradiance was covered in issue 1 of the CDS
newsletter. To prodce the irradiance full sun spectral scans were obtained
(FSUN) on a regular (monthly) basis. The evolution of the Sun as recorded in
these observations are displayed above for Mg IX and Fe XVI. From these observations
we can see that the major evolution of the sun in the EUV is associated with the active
region emission. Over time the active regions emission appears to become more
extended as more sunspots emerge and migrate to lower latitudes.
During this time period the magnetic field associated with these active
regions is transported to the surrounding quiet sun (and ultimately the
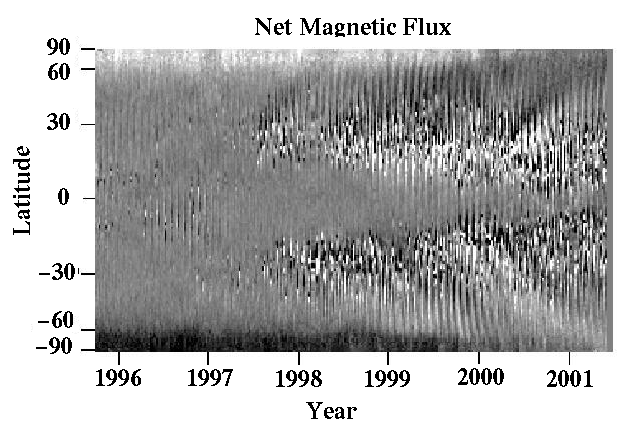
polar regions) by the Sun's meridional flow. This is illustrated below
in the synoptic map produced from Kitt Peak magnetograms over the rise of the current
solar cycle (courtesy of Duncan Mackay and Karen Harvey).
 Synoptic map of Kitt Peak Magnetograms over the rise
of the current solar cycle.
This process supplies and replenishes the quiet sun magnetic field and dictates the characteristic emergence of features over the solar cycle
such as high latitude streamers and low latitude coronal holes.
 GIS SPECT_1 observations of the quiet sun over the
rise of the current solar cycle.
Synoptic observations of the quiet sun have been obtained on a regular basis with
the Grazing Incidence Spectrometer. The dramatic effect of the transport of magnetic
flux is characterised by more than an order of magnitude enhancement observed in the flux of Fe XV and XVI.
This is consistent with the offlimb temperature measurements which we discuss above.
These observations together support the hypothesis that the positive temperature
gradients which we observe are real and not due to the effect of supersition
of different isothermal flux tubes with different scale heights. The solar cycle evolution of
the transition region emission is a result of the increased energy
deposition into the overlying corona over the cycle.
GIS Slit Anomaly - Alternative GIS Studies
Carl Foley
Whilst the problem with the slit mechanism is resolved it is still
possible to perform observations with the GIS which do not move in the N-S
direction, which are either sit and stare observations or simple E-W scans.
A strength of using the GIS is that it is operated in a photon
counting mode. This allows photon events to be discriminated by pulse height, thereby
allowing cosmic ray hits to be excluded from the accumulated spectra. The GIS is
therefore able to obtain deep exposures relatively free of cosmic ray
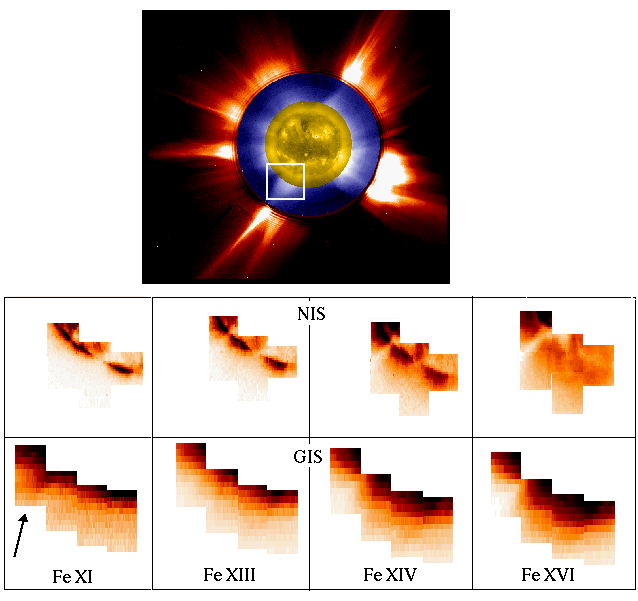
background. An example of this is illustrated below for an offlimb
observation made with both the NIS (top row), and GIS (bottom row) on the
5th August 1999. This observation was of the base of a coronal Streamer as
delineated in the LASCO C2, MLSO, EIT 284 A, composite image.
 (top panel) Composite image formed from (outer) LASCO
C2, MLSO MK 4 Coronagraph, EIT 284 A - The region delineated illustrates the
CDS region of interest
(middle panel- label NIS) NIS Spectral images of the
base of the indicated streamer base
(bottom panel- label GIS) GIS Spectral images of the
region above the NIS observations. The interesting feature in this plot is
the
Fe XI which emission appears to dominate at the edge of the streamer where the field is expected to be open (arrowed)
I have summarized studies which are ok to run whilst the slit anomaly
problem is resolved here.
The GEWS3 studies, are ideal for off limb observations and can be used in
sequence with careful pointing to map large off field regions as is
illustrated in the figure above.
| Study Name | No. | Var | dur | Study Name |
| GIMCP_1 | 1 | 1 | 34.0000 | GIS MCP TEST PART 1 |
| GIMCP_2 | 2 | 1 | 34.0000 | GIS MCP TEST PART 2 |
| TEST1_I | 4 | 1 | 3649.00 | GIS FIRST LIGHT TEST |
| TEST1_II | 5 | 1 | 10033.0 | GIS FIRST LIGHT TEST - 2ND PART |
| TEST1CH1 | 5 | 2 | 10033.0 | CORONAL HOLE FIRST LIGHT TEST |
| TEST1III | 6 | 1 | 661.000 | GIS FIRST LIGHT TEST - 3RD PART |
| TEST1_S2 | 8 | 1 | 3649.00 | COMMISSIONING TEST USING SLIT 2 |
| TEST1AR2 | 8 | 2 | 407.000 | GIS TEST1 ACTIVE REGION |
| TEST1CH2 | 20 | 1 | 10031.0 | GIS TEST1 CORONAL HOLE |
| ICAL2_1 | 28 | 1 | 673.000 | INTERCAL 2 PART 1 |
| TGRAD_1N | 50 | 1 | 2035.00 | TEMPERATURE GRADIENT IN A CORONAL HOLE - PHASE 1, NEW |
| TGRAD_1N | 50 | 2 | 335.000 | TEMPERATURE GRADIENT IN A CORONAL HOLE - PHASE 1, NEW |
| TGRAD_2 | 51 | 1 | 18033.0 | TEMPERATURE GRADIENT IN A CORONAL HOLE - PHASE 2 |
| TGRAD_2 | 51 | 2 | 1833.00 | TEMPERATURE GRADIENT IN A CORONAL HOLE - PHASE 2 |
| TGRAD_3 | 52 | 1 | 40021.0 | TEMPERATURE GRADIENT IN A CORONAL HOLE - PHASE 3 |
| TGRAD_1X | 54 | 1 | 2035.00 | TEMP GRADIENT IN CH PHASE 1 - MODIFIED |
| TGRAD_2X | 62 | 1 | 18033.0 | TEMPERATURE GRADIENT IN A CORONAL HOLE - PHASE 2, 2X240 SLIT |
| TGRAD_2X | 62 | 2 | 1833.00 | TEMPERATURE GRADIENT IN A CORONAL HOLE - PHASE 2, 2X240 SLIT |
| TGRAD_3X | 64 | 1 | 40021.0 | TEMPERATURE GRADIENT IN A CORONAL HOLE - PHASE 3, 2X240 SLIT |
| TGRAD_3X | 64 | 2 | 4021.00 | TEMPERATURE GRADIENT IN A CORONAL HOLE - PHASE 3, 2X240 SLIT |
| TGRAD_3X | 64 | 3 | 8021.00 | TEMPERATURE GRADIENT IN A CORONAL HOLE - PHASE 3, 2X240 SLIT |
| TEST1_I2 | 68 | 1 | 1829.00 | GIS SIT-AND-STARE 4''X4'' |
| GLONG | 69 | 1 | 1829.00 | GIS SIT-AND-STARE 2X240'' |
| CHROM_G4 | 73 | 1 | 4211.00 | CHROMOSPHERIC OSCILLATIONS : ALL CHANNELS GIS |
| BROAD | 80 | 1 | 10126.0 | LINE BROADENING WITH ALTITUDE |
| GIBOUND | 84 | 1 | 2549.00 | GI LONG SLIT CH BOUNDARY STUDY |
| GISAT44S | 84 | 2 | 6149.00 | GIS LONG SLIT ATLAS - 4X4 ARCMINUTES |
| HTBNDWE | 85 | 1 | 541.000 | CORONAL HOLE BOUNDARY STUDY (W-E) |
| HTBNDWE | 85 | 2 | 542.000 | CORONAL HOLE BOUNDARY STUDY (W-E) |
| G2AL | 91 | 1 | 2035.00 | GIS ACROSS THE LIMB, 4X4 SLIT |
| G2AL | 91 | 2 | 8035.00 | GIS ACROSS THE LIMB, 4X4 SLIT |
| GEAST | 92 | 1 | 4021.00 | GIS CORONA ABOVE THE EAST LIMB, 2X240 SLIT |
| GWEST | 93 | 1 | 4021.00 | GIS CORONA ABOVE THE WEST LIMB, 2X240 SLIT |
| CHMAP_A | 98 | 1 | 173.000 | POLAR CORONAL HOLE MAPPING - PART A |
| CHMAP_A | 98 | 2 | 175.000 | POLAR CORONAL HOLE MAPPING - PART A |
| G2AL4 | 98 | 3 | 6082.00 | GIS ACROSS THE LIMB, 4X4 SLIT, 240''X4'' AREA |
| G2AL4 | 98 | 4 | 12082.0 | GIS ACROSS THE LIMB, 4X4 SLIT, 240''X4'' AREA |
| HTBNDSS1 | 100 | 1 | 690.000 | POLAR CORONAL HOLE BOUNDARY - SIT & STARE |
| HTBNDSS1 | 100 | 2 | 691.000 | POLAR CORONAL HOLE BOUNDARY - SIT & STARE |
| EWSCAN | 105 | 1 | 3023.00 | GIS E-W SCAN, 40''X4'', 4X4 SLIT |
| EWSCAN | 105 | 2 | 1023.00 | GIS E-W SCAN, 40''X4'', 4X4 SLIT |
| EWSCAN | 105 | 3 | 323.000 | GIS E-W SCAN, 40''X4'', 4X4 SLIT |
| GISAT_S | 119 | 1 | 522.000 | GIS LONG SLIT ATLAS |
| GEAST2 | 128 | 1 | 4010.00 | GIS CORONA ABOVE THE EAST LIMB, 2X240 SLIT V.2 |
| GEAST3 | 129 | 1 | 4010.00 | GIS CORONA ABOVE THE EAST LIMB, 2X240 SLIT V.3 |
| GIS2SIN | 131 | 1 | 212.000 | GIS SINGLE EXPOSURE 4''X4'' |
| GIS2SIN | 131 | 2 | 512.000 | GIS SINGLE EXPOSURE 4''X4'' |
| GIS2SIN | 131 | 3 | 1012.00 | GIS SINGLE EXPOSURE 4''X4'' |
| GWEST3 | 153 | 1 | 4010.00 | GIS CORONA ABOVE THE WEST LIMB, 2X240 SLIT V.3 |
| GWEST2 | 154 | 1 | 4010.00 | GIS CORONA ABOVE THE WEST LIMB, 2X240 SLIT V.2 |
| GWEST2S | 156 | 1 | 4010.00 | GIS CORONA ABOVE THE WEST LIMB, 2X240 SLIT V.2 (SOUTH 120 ARCSEC) |
| EWGSCAN2 | 158 | 1 | 12046.0 | W-E 120X4 ARCSEC SCAN WITH SLIT 4X4 ALL LINES GIS |
| GLOW_1 | 170 | 1 | 14410.0 | GIS LOW TELEMETRY MODE STUDY - OFF LIMB |
| HRBNDWE | 179 | 1 | 1106.00 | CORONAL HOLE BOUNDARY STUDY (W-E), HIGH RATE |
| SITNSTAR | 182 | 1 | 540.000 | SIT 'N STARE AT ONE POINT |
| GIS_TEST | 202 | 1 | 11660.0 | GIS LONG DURATION TEST |
| HTGIWE | 214 | 1 | 2089.00 | CORONAL HOLE BOUNDARY STUDY (W-E), MEDIUM RATE |
| GEXSNS | 216 | 1 | 12.0000 | GIS EXTENDED CORONA SIT N STARE |
| GEXSNS | 216 | 2 | 20.0000 | GIS EXTENDED CORONA SIT N STARE |
| GEXSNS | 216 | 3 | 30.0000 | GIS EXTENDED CORONA SIT N STARE |
| GEXSNS | 216 | 4 | 40.0000 | GIS EXTENDED CORONA SIT N STARE |
| GEXSNS | 216 | 5 | 50.0000 | GIS EXTENDED CORONA SIT N STARE |
| GEXSNS | 216 | 6 | 50.0000 | GIS EXTENDED CORONA SIT N STARE |
| GEXSNS | 216 | 7 | 40.0000 | GIS EXTENDED CORONA SIT N STARE |
| GEXSNS | 216 | 8 | 20.0000 | GIS EXTENDED CORONA SIT N STARE |
| GEXSNS | 216 | 9 | 12.0000 | GIS EXTENDED CORONA SIT N STARE |
| G2EW3 | 222 | 1 | 4583.00 | GIS EAST-WEST, 4X4 SLIT, 180''X4'' AREA |
| O_SPOT10 | 225 | 1 | 2750.00 | SUNSPOT 3-MINUTE OSCILLATIONS |
| GSS250W | 226 | 1 | 3995.00 | GIS TIME SERIES, 250 EXPOSURES |
| POINT_EW | 238 | 1 | 101.000 | E/W POINTING TEST |
| GIWEMT1 | 243 | 1 | 550.000 | SIT-AND-STARE AND MOVE STUDY (W-E) |
| GIWEMT2 | 244 | 1 | 1060.00 | SIT-AND-STARE AND W-E SCAN |
| CDSCD | 250 | 1 | 325.000 | CDS CORONAL DYNAMICS |
| CDSCD | 250 | 2 | 321.000 | CDS CORONAL DYNAMICS |
| GCD5 | 251 | 1 | 145.000 | GIS CORONAL DYNAMICS |
| GEWS3 | 252 | 1 | 360.000 | GIS EAST-WEST SCAN (SLIT3) |
| GEWS3 | 252 | 2 | 660.000 | GIS EAST-WEST SCAN (SLIT3) |
| GEWS3 | 252 | 3 | 960.000 | GIS EAST-WEST SCAN (SLIT3) |
| GEWS3 | 252 | 4 | 1260.00 | GIS EAST-WEST SCAN (SLIT3) |
From the CDS Operations Management Team in the Space Science & Technology Department at
CCLRC Rutherford Appleton Laboratory
Site maintained by
John Rainnie.
Last revised on Tuesday (11/Dec/2001) at 22:57.
|
|


