
|
Newsletter | |
|
Issue 7: 15th October 2002
Latest News Welcome to the CDS Newsletter. The goal of this Newsletter is to inform the CDS user community of
This Month's Topics:
CDS Meeting A CDS Users Meeting will be held in Dublin on 10 and 11 April 2003, in conjunction with the National Astronomy Meeting/UK Solar Physics Meeting, 7-11 April 2003. CDS Meeting Schedule: Thursday, 10 April, 16:00 - 17:30 CDS Science Session Friday, 11 April, 9:00 - 10:30, 11:00 - 12:30, 14:00- 15:30, three CDS Users sessions. The 'CDS Science' session on Thursday will contain science talks presenting results obtained from CDS data. These presentations will be in a usual conference format. During Friday sessions we will discuss issues related to data analysis and the instrument, with full participation from the audience. More details on the CDS Meeting programme will be sent later. Information about the NAM/UKSP Meeting is available at: http://star.arm.ac.uk/nam2003/ Please mark the CDS Meeting in your calendars. We look forward to seeing you in Dublin. - Andrzej Fludra & Peter Young MEDOC Campaign Medoc Campaign #10 will take place 21 Oct - 03 Nov. CDS will support several observing programmes, listed on the SOHO monthly calendar at: http://sohowww.nascom.nasa.gov/soc/head_calendar.html EGSO Update The EGSO (European Grid of Solar Observations) project is progressing well with various technical surveys and requirements reports being produced. Public documents can be seen on the Wiki website to which visitors may also register and contribute: http://www.mssl.ucl.ac.uk/grid/cgi-bin/twiki/view.cgi/Main/WebHome Dave Pike CHIANTI V4.0 RELEASED Version 4.0 of the CHIANTI database for astrophysical spectroscopy has been released. The main new features included in this version are the inclusion of proton excitation rates and photoexcitation. In addition there are a number of updated ions and improvements to both the database and the software. A paper describing the new contents of CHIANTI Version 4.0 will appear soon in The Astrophysical Journal Supplement Series (Young et al., 2002) and a preprint is available at http://xxx.lanl.gov/abs/astro-ph/0209493 The CHIANTI package is distributed in two ways, as a stand-alone package and through SolarSoft. The CHIANTI package, and information on how to install it, can be found at our web sites: http://wwwsolar.nrl.navy.mil/chianti.html http://www.chianti.rl.ac.uk/ http://www.damtp.cam.ac.uk/user/astro/chianti/chianti.html http://www.arcetri.astro.it/science/chianti/chianti.html - Peter Young A wavelet analysis of quasi-periodic variability across a solar coronal hole region M. S. Marsh, R. W. Walsh and B. J. I. Bromage, 2002, A&A 393, 649
High time resolution (~13 s cadence) Solar and Heliospheric
Observatory (SOHO) Coronal Diagnostic Spectrometer (CDS) Grazing Incidence
Spectrometer (GIS) time series data is analysed for evidence of
quasi-periodic variability in the solar corona. The observations are
obtained from a GIS study of a coronal hole boundary region taken in
October 1997. A wavelet analysis is applied to EUV emission lines covering
a temperature range of log Te=5.3-6.1 K. Wavelet analysis
allows the frequency and temporal information of any periods present
within the data to be analysed. Statistically significant periods are
found within the range 100-900 s and 1500 s. Observations of short
wavepackets with periods of the order 50-100 s with durations of 2-5
cycles are reported. Observations of a decay in the driving period over
time are also described.
As mentioned in an earlier newsletter ( issue 3), an attempt was made to validate our understanding of basic emission mechanisms in the solar corona during a special SOHO roll maneuver last year, by making use of the polarization sensitivity of CDS. Preliminary analyses of these observations show that the expected EUV polarization signatures are indeed seen in coronal emission of low temperature lines above the limb, at the expected locations and with the proper sign. But the observed strength of these signals is much higher than expected, and on the verge of what seems physically possible. A similar result was obtained from the 1997 SOHO roll, although at the time there was concern that the very high intensity modulations observed may have been due to time-variability instead of due to polarization effects. The 2001 data do not allow that interpretation, so something very peculiar may actually be going on in the solar corona.
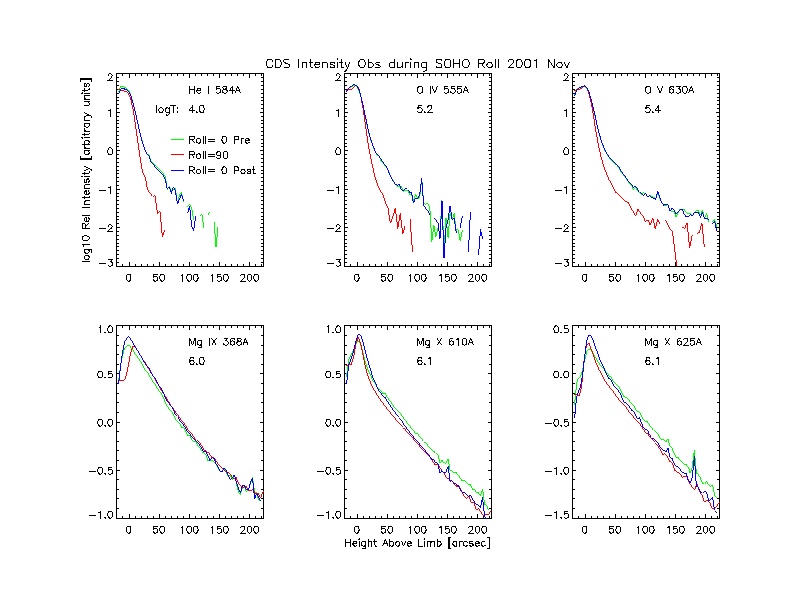
Figure 1 shows intensity gradients up to 220 arcsec above the limb measured
before, during, and after the roll maneuver. Since the entire sequence took
nearly two and a half days to complete, observations were made at the north
solar pole to minimize effects of temporal variations. In all cases, the pre-
and post-roll curves are nearly identical, confirming this lack of variability.
The first three lines shown, He I 584A, O IV 555A, and O V 630A, are all formed
at temperatures below logT = 5.4. All three have a break in their exponential
intensity falloff at about 20-30 arcsec above the limb, indicative of a change
between emission dominated by collisional excitation (with an Ne^2 dependence)
to radiation from resonance scattering (which varies as Ne to the first power).
This latter radiation should be linearly polarized in the plane parallel to the
limb because of the asymmetric illumination field incident on the scattering
ions. And because the CDS normal-incidence spectrometer is fed by sectors of
a telescope with two grazing-incidence reflections, its response should then
decrease at the 90-degree roll position for such polarized light, which is
exactly what is observed.
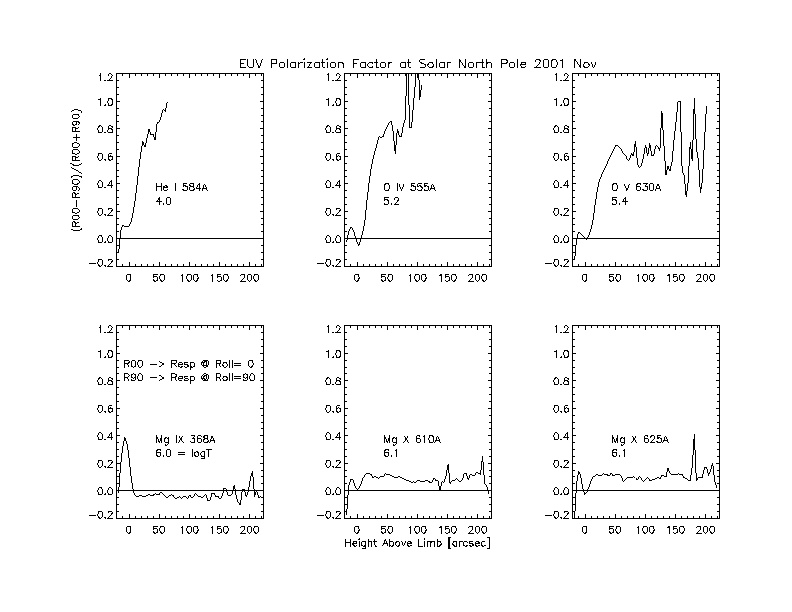
Thus, these detections of the expected intensity gradients and polarization
signatures ought to provide a unique and compelling confirmation of the two
principal emission mechanisms thought to operate in the solar corona. The
problem is that the measured intensity modulations are far too large to be
explained by simple models, which predict response variations near 10% as a
function of roll angle from heights at which resonance scattering dominates.
Figure 2 shows that the measured responses for the three low-temperature lines
were modulated by up to 80% or so, implying a source polarization near 100%.
This is very difficult to understand, yet seems to confirm similar results from
the 1997 SOHO roll maneuver. The sun apparently still has some surprises for
those who dare explore her secrets.
|