
|
Newsletter | |
|
Issue 8: 20 January 2003
Latest News Welcome to the CDS Newsletter. The goal of this Newsletter is to inform the CDS user community of
This Month's Topics:
CDS Science Session at NAM/UKSP 2003 We are holding a special 'CDS Science' session at the joint National Astronomy Meeting & UK Solar Physics Meeting in Dublin in April 2003, to present latest results obtained with the Coronal Diagnostic Spectrometer on SOHO. The session will take place on Thursday, 10 April, 16:00 - 17:30. The 'CDS Science' session will consist of one review presentation and four contributed talks, and posters. Everyone is welcome. Oral and poster contributions are invited. Results based on the CDS data are preferred for presentation in this session. Participants should register for the NAM/UKSP meeting at: http://star.arm.ac.uk/nam2003/ Paper title and abstract can be entered on the NAM registration page. Titles and abstracts should also be e-mailed to Andrzej Fludra, A.Fludra@rl.ac.uk The selection of oral contributions is at the discretion of organizers. CDS Users Meeting at NAM/UKSP 2003 On the last day of the NAM/UKSP meeting, Friday, 11 April, there will be a CDS Users Meeting, devoted to the discussion of practical issues relevant to the analysis of past data and planning of new observations with the Coronal Diagnostic Spectrometer. Each of the three sessions (09:30-11:00, 11:30-13:00, 14:30-16:00) will consist of a brief introduction and an open discussion. The session themes are: 'Active Region Studies', 'Dynamic Events', and 'Analysis of Large Data Sets'. Here is the list of suggested topics and questions we would like to address: Session I. Active Regions - density diagnostics (what diagnostics are best; blends and other line fitting problems [pre-, and post-June 1998]; can densities be measured along loops) - identifying loops (how to identify loops at different temperatures? how to co-align loops from NIS1 and NIS2?) Session II. Dynamic events - how are CDS line profiles used to study dynamic events (line broadening, line shifts; what analysis tricks are there)? - what periodic behaviour has been seen in CDS data? Session III. Large data-sets, automatic data processing - what large data-sets (defined as a consistent set of data obtained regularly over a period of several months or more) are available; what was their original purpose; what is the progress in their analysis. - what techniques have people developed for automatically processing large quantities of CDS data? (particularly line profile fitting) - what data events (flares, blinkers, etc.) and parameters could be automatically extracted from CDS data to form a useful catalogue for grid work? To give us an idea of the number of participants, please send an e-mail to Andrzej at fludra@cdso8.nascom.nasa.gov. Also indicate if you have issues you would like discussed in these sessions or contributions you would like to make. Contributions from participants are encouraged. Please mark the CDS sessions in your calendars. We look forward to seeing you in Dublin. - Andrzej Fludra & Peter Young Chromospheric Evaporation and Warm Rain During a Solar Flare Observed in High Time Resolution with the Coronal Diagnostic Spectrometer Aboard SOHO Jeff Brosius, ApJ 586, in press (April 1, 2003)
We present EUV light curves, Doppler shifts, and line
broadening measurements for a flaring solar active region
obtained with CDS under conditions of (1) comprehensive
temporal coverage (including the quiescent preflare,
impulsive, and gradual decline phases), (2) high time
resolution (9.83 s), and (3) narrow field of view (4 arcsec
by 20 arcsec). The four strong lines of O III at 599.587 A,
O V at 629.732 A, Mg X at 624.937 A, and Fe XIX at
592.225 A are analyzed, and provide diagnostics of plasma
dynamics for log T between 4.9 and 6.9. Wavelengths and
widths measured during the preflare and late decline phases
provide standards against which Doppler shifts and excess
line broadening are measured during the impulsive and early
decline phases. The entire profile of all four lines is blueshifted
early during the impulsive rise of the flare, but only the O III,
O V, and Mg X lines subsequently exhibit multiple
components and downflows. These downflows provide
evidence of ``warm rain" due to cooling coronal flare plasma
following chromospheric evaporation during the impulsive phase.
O III and O V exhibit a pronounced precursor brightening during
which the Fe XIX emission emerges above the noise; this,
combined with the fact that the O III and O V intensities begin
their impulsive rise earlier than do those of Mg X and Fe XIX,
is consistent with the transport of coronal flare energy to the
chromosphere by nonthermal particle beams.
In this paper we test one of the mechanisms proposed to explain the
intensities and other observed properties of the solar helium spectrum,
and in particular of its Extreme-Ultraviolet (EUV) resonance lines.
The so-called Photoionisation-Recombination (P-R) mechanism involves
photoionisation of helium atoms and ions by EUV coronal radiation, followed
by recombination cascades. We present calibrated measurements of EUV flux
obtained with the two CDS spectrometers on board SOHO, in quiescent solar
regions. We were able to obtain an essentially complete estimate of
the total
photoionising flux in the wavelength range below 504 A (the
photoionisation threshold for HeI, as well as simultaneous
measurements with the same instruments of the intensities of the strongest
EUV HeI and HeII lines: HeI 584, HeI 537, and HeII 304. We find that there are not
enough EUV ionising photons to account for the observed helium line
intensities. More specifically, we conclude that HeII intensities
cannot be explained by the P-R mechanism alone. Our results, however, leave
open the possibility that the HeI spectrum could be formed by the P-R
mechanism, with the HeII 304 line as a significant
photoionisating source.
We report here for the first time observations of prominence
velocities over a wide range of temperatures and with a high time
cadence. Our study of ultraviolet movies of prominences reveals that
multithermal features with speeds of 5-70 km/s perpendicular to the
line of sight are common in the prominences which showed traceable
motions. These speeds are noticeably higher than the typical speeds of
5-20 km/s observed in H-alpha data from "quiet" prominences and are
more typical of "activated" prominences in which speeds of up to 40
km/s have been reported.
The observations were performed using five separate datasets taken by
the Solar and Heliospheric Observatory's Coronal Diagnostic
Spectrometer (SOHO/CDS) in its wide slit overlappogram mode in lines
from He I, O V, and Mg IX and a separate prominence observation taken
with both the Transition Region and Coronal Explorer (TRACE) in its
1216 and 1600 � bands and in H-alpha by the Swedish Vacuum Solar
Telescope (SVST) at La Palma. The movies were taken with cadences >
1 image per minute and were made simultaneously or
near-simultaneously in spectral lines formed at two or more
temperatures.
We traced motion that lasted for 3 to 20 minutes and went distances up
to 10^5 km. Most, but not all, of these were chiefly horizontal. In
many cases we were able to observe the same motions over temperature
ranges from 20,000 to 250,000 K or 10,000 to 100,000 K.
Observations are compared with model predictions.
Extreme ultraviolet observations of plumes in polar coronal holes are
presented and their spectroscopic signatures discussed. The study
focuses on the base of plumes seen on the disk of the Sun with the
Coronal Diagnostic Spectrometer (CDS) on the Solar and Heliospheric
Observatory (SOHO) satellite. Spectroscopic diagnostic techniques are
applied to characterise the plumes in terms of density, temperature,
emission measure and element abundance. Attention is drawn to the
particular limitations of some of the techniques when applied to plume
structures. In particular, we revisit the Widing & Feldman (1992)
findings of a plume having a large first ionization potential (FIP)
effect of 10, showing that instead the Skylab data are consistent with
no FIP effect. We present for the first time CDS-GIS (grazing
incidence spectrometer) observations of a plume. These observations
have been used to confirm the results obtained from normal incidence
(NIS) observations. We find that polar plumes exhibit the same
characteristics as the Elephant's Trunk equatorial plume. The most
striking characteristic of the plume bases is that they are
near-isothermal with a peak emission measure at transition region
temperatures ~ 8 x 10^5 K. At these temperatures, plumes have averaged
densities Ne = 1.2 x 10^9 cm-3, about twice the value of the
surrounding coronal hole region. Element abundances in the plumes are
found to be close to photospheric, with the exception of neon which
appears to be depleted by 0.2 dex relative to oxygen. The absence of
a significant FIP effect in plumes is consistent with fast solar wind
plasma, although it is not sufficient to prove a link between the two.
Finally, we present a comparison between GIS spectra and the SOHO EIT
(EUV Imaging Telescope) broad-band images, showing that temperatures
derived from the EIT ratio technique are largely overestimated, for
plumes and coronal holes. This is partly due to the fact that the so
called `Fe XII 195 A' and `Fe XV 284 A' filters are not
isothermal, and in coronal holes and plumes lower-temperature lines
dominate the EIT signal.
We discuss the relationship between the EUV spectral line intensities
and the photospheric magnetic flux in solar active regions. Since the
histograms of the magnetic flux density in active region plages can be
approximated by an exponential function, the equation describing how
the observed total line intensity integrated over an active region
area arises from the magnetic field, can be approximated by a Laplace
integral. We use this property to solve an inverse problem and derive
a function relating the line intensity from individual loops to the
photospheric magnetic flux density at their footpoints. We propose a
simple model in which the intensity of a coronal line Fe XVI 360.8 A
in an individual coronal loop is proportional to the footpoint
magnetic flux density to the power of 'delta' and explore how well the
value of 'delta' is constrained by the observations. Using EUV
spectra from the Coronal Diagnostic Spectrometer (CDS) on SOHO and
magnetograms from SOHO Michelson Doppler Imager for 26 active regions
without sunspots, we find that the value of 'delta' depends on the
magnetic flux density threshold used to define active region magnetic
area. When even the weakest fields are included, we obtain 'delta' =
1.3, where 1.0 < 'delta' < 1.6 with 90% confidence. This result can be
used to provide constraints on coronal heating models.
The radiometric calibration of spectrometric telescopes assures that
the observed spectral radiance (or irradiance) is measured on a scale
that is defined by the radiometric standards realised and used in
terrestrial laboratories. All SOHO instruments therefore have been
calibrated by use of source and detector standards that are traceable
to the primary radiometric standards. During several Joint Observing
Programmes (JOPs) the performance of individual instruments has been
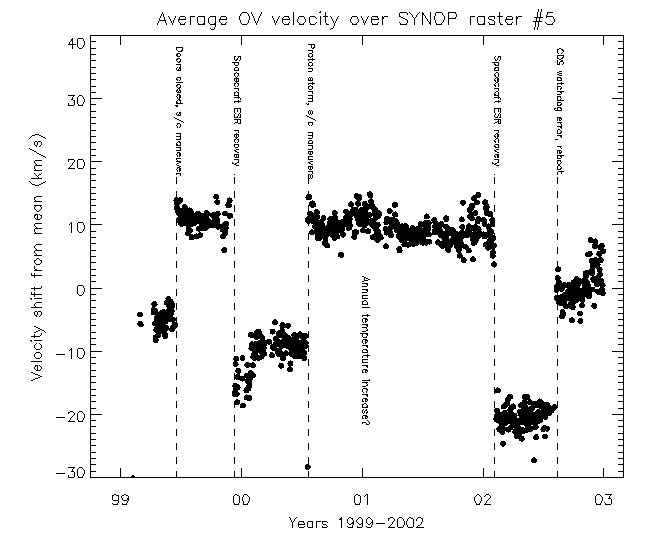
monitored and in-flight comparisons have been made. Users often ask about the accuracy of the CDS NIS wavelength calibration - the conversion of detector pixel positions to wavelengths. The data analysis software provides the routine PIX2WAVE which performs a conversion. However, we have always insisted that this can only be taken as a guide and should never be used for calculating absolute velocities. Even though the CDS optical bench is temperature-controlled to try and minimize the temperature effects on the wavelength calibration found early on in the mission, significant changes in the wavelength zero-point can still occur. Some of these are illustrated below where we plot the average OV velocity of raster #5 from the daily synoptic program. Raster #5 was chosen as previous analysis has shown that any short-term temperature variations have settled down by then. The plot shows that the wavelength zero-point can change abruptly over a range of 30 km/s. At 630A this corresponds only to about 0.5 pixels. All of the major changes are associated with significant spacecraft and/or CDS events, as labelled. In addition, during the longest 'unbroken' series of data (mid-2000 to early-2002), there is a hint of a much smaller effect which mimics some of the annual temperature variations seen in the CDS structure.
|