
|
Newsletter | |
|
Issue 9: 12 May 2003
Latest News Welcome to the CDS Newsletter. The goal of this Newsletter is to inform the CDS user community of
This Month's Topics:
REPORT ON THE CDS USER GROUP MEETING AT NAM/UKSP 2003 A. Fludra CDS featured prominently at the NAM/UK Solar Physics meeting in Dublin, 7-11 April 2003. On 10 April we held a special session on "Results from CDS", and several talks using CDS data were given in other solar sessions as well. The CDS User Group Meeting was held on 11 April, 2003. Main objectives of the CDS Users' meeting were:
1. CDS Status - A. Fludra / J. Payne CDS in numbers:
Carl is preparing an easy guide to analysing GIS data, including ways to identify ghost-free regions. The first, still evolving version is available at: http://www.mssl.ucl.ac.uk/www_solar/soho/ Note that for a particular line of interest, it is possible to design the GIS look-up table to make that wavelength range ghost-free (this applies only to new studies). A draft of a somewhat specialized paper about the GIS gain depression is available at: http://www.mssl.ucl.ac.uk/www_solar/publications/ltgd.ps 3. Sensitivity Differences in Pre-Loss and Post-Recovery NIS/CDS Spectrum - Steven Chapman ../newsletter/issue9/SChapman_Dublin_NIS1_sensitivity.ppt 4. Cross-Calibration of CDS USUN and TIMED Spectra - Bill Thompson ../newsletter/issue9/WThompson_Dublin_cds.ppt The conclusion from Steven's and Bill's results is that the NIS-1 sensitivity decreased after the SOHO recovery by about a factor of two. The comparison of USUN and TIMED spectra provides a direct measure of this decrease, while Steven's approach gives some insight into the variation of the Mg IX intensity with the solar cycle. 5. Introduction to Active Region Results - Peter Young ../newsletter/issue9/PYoung_Dublin_active_regions.ppt Peter's intention was to stimulate a discussion on what are the most important results from active region observations. Some answers are in the presentations that follow: 6. Oslo Sunspot Studies - Olav Kjeldseth-Moe ../newsletter/issue9/Olav_Dublin_sunspots.ppt This is one of the Large Data Sets (see below for more explanations of this term). It has resulted in many papers by Brynildsen et al. 7. A Destructive Effect of Solar Rotation on Analysis of Oscillations - Olav Kjeldseth-Moe 8. Results from Active Region Campaigns - Giulio Del Zanna A vast amount of results which will some day become available online. 9. Oslo Active Region Loop Studies - Olav Kjeldseth-Moe ../newsletter/issue9/Olav_Dublin_active_regions.ppt Another large data set, and more papers from the Oslo group. Movies are included separately: ../newsletter/issue9/Olav_Dublin_eitcdsfov_movie.mpg ../newsletter/issue9/Olav_Dublin_wfov_movie.mpg 10. UCLAN Polarity Reversal Studies - Barbara Bromage According to Barbara, a full polarity reversal has not taken place yet. This large volume of data will be a part of Steven Chapman's thesis. 11. NIS Spectral Diagnostics - Giulio Del Zanna http://www.damtp.cam.ac.uk/user/astro/gd232/cds/ This is a practical advice on useful density diagnostics line ratios and CDS calibration. 12. European Grid of Solar Observations (EGSO) and CDS - Simon Martin ../newsletter/issue9/SMartin_Dublin_EGSO.ppt 13. Large Data Sets - Andrzej Fludra A number of studies has been run regularly for an extended period of time and accumulated a large volume of data. Some of them have been run since the beginning of the mission (e.g. SYNOP, or the NIS quiet sun spectral atlas), others started in 1997 or later. This group of studies is called here 'large data sets'. Any observation that is a consistent set of data obtained regularly over a period of several months or more, falls into this category. There is a natural curiosity about the progress in their analysis. Perhaps those programmes and all of us could benefit from pondering the following questions:
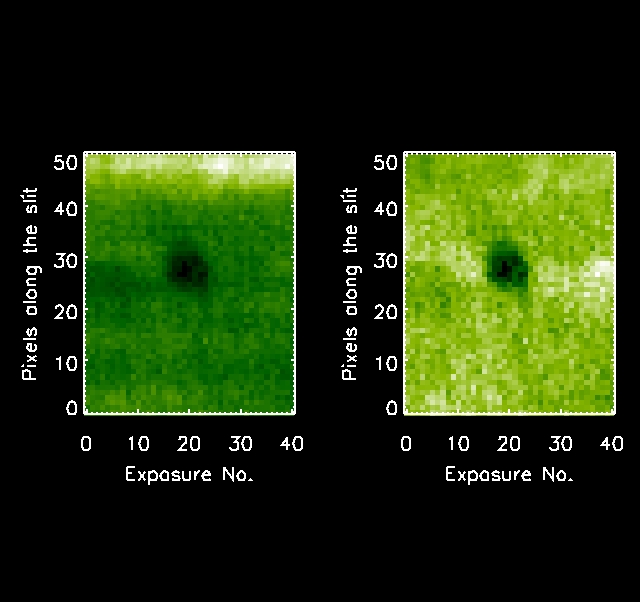
MERCURY TRANSIT - Andrzej Fludra On May 7, 07:50 - 13:17 UT, Mercury transited the solar disk. SOHO instruments carried out special observations of this transit. CDS made wide slit movies and sit & stare observations with the 2x240 and 4x240 slit. CDS movies are shown at http://soho.nascom.nasa.gov/hotshots/2003_05_07/ (see at the middle of that page). An example of the sit & stare study in the He I 584 A line is shown below (the right-hand panel is contrast enhanced). That Mercury is not seen as a perfect black circle qualitatively agrees with our present knowledge of the CDS spatial point spread function - this data set should help us quantify the PSF better.
The relative Doppler and non-thermal velocities of quiet-Sun and
active-region blinkers identified in O V with CDS are calculated.
Relative velocities for the corresponding chromospheric plasma below are
also determined using the He I line. O V blinkers and the chromosphere
directly below, have a preference to be more redshifted than the normal
transition region and chromospheric plasma. The ranges of these enhanced
velocities, however, are no larger than the typical spread of Doppler
velocities in these regions. The anticipated range of Doppler velocities
of blinkers are 10 - 15 km/s in the quiet-Sun (10 - 20 km/s in
active-regions) for He I and 25 - 30 km/s in the quiet-Sun (20 - 40 km/s
in active-regions) for O V. Blinkers and the chromosphere below also have
preferentially larger non-thermal velocities than the typical background
chromosphere and transition region. Again the increase in magnitude of
these non-thermal velocities is no greater than the typical ranges of
non-thermal velocities. The range of non-thermal velocities of blinkers in
both the quiet-Sun and active-regions are estimated to be 15 - 25 km/s in
He I and 30 - 45 km/s in O V. There are more blinkers with larger Doppler
and non-thermal velocities than would be expected in the whole of the
chromosphere and transition region. The recently suggested mechanisms for
blinkers are revisited and discussed further in light of the new results.
We perform a hydrodynamic simulation of a cooling coronal loop and
calculate the time-dependent ion populations of the most abundant elements
of the solar atmosphere at each time-step. We couple the time-dependent
ion balance equations to the hydrodynamic equations in order to treat the
energy loss through radiation in a self-consistent way by allowing for the
emission from a potentially nonequilibrium ion population.
This paper examines the relationship between a coronal wave, filament
eruption, flare and Coronal Mass Ejection (CME) which occurred on 2001,
April 10th. We study the pre-flare activity which includes the eruption of
a filament and a coronal wave. A large X-ray flare and a CME follow. We
discuss how these phenomena are related and compare our results to recent
models. These are found to be largely consistent with the numerical
simulations of a flux rope driven CME as presented recently in Chen et al.
(2002).
|